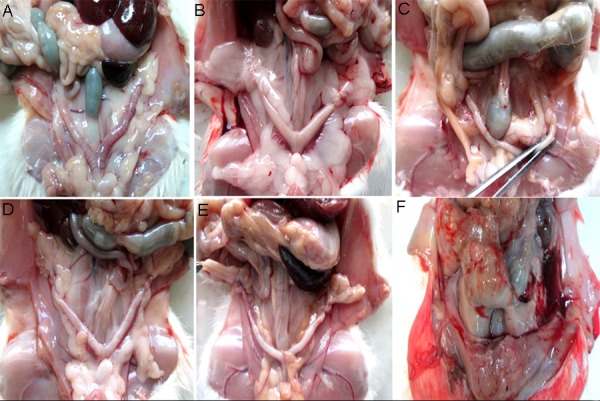
Fig.1.

Ovary morphology showing decrease in visceral fat in the grape seed extract (GSE) treated groups compared with control and polycystic ovary syndrome (PCOS). Fat tissue in the abdominal cavity, particularly around the uterus and ovaries decreased in PCOS treatment groups. A. Control group, B. PCOS group, C. PCOS group treated with 50 mg/kg GSE, D. PCOS group treated with 75 mg/kg GSE, E. PCOS group treated with 100 mg/kg GSE, and F. PCOS group treated with 200 mg/ kg GSE.
