FIGURE 4.

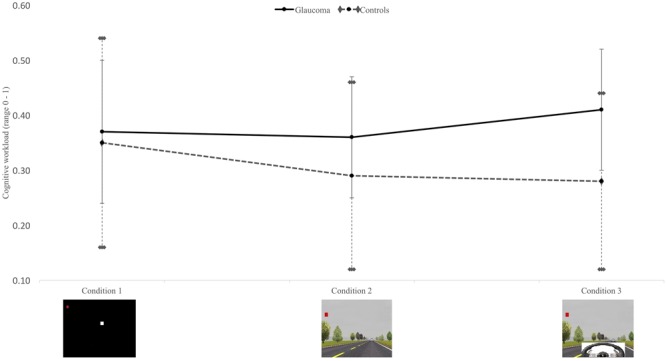
Mean and standard deviations for cognitive workload between the glaucoma (n = 20) and healthy control (n = 13) groups across three conditions; between group effect p = 0.02.

Mean and standard deviations for cognitive workload between the glaucoma (n = 20) and healthy control (n = 13) groups across three conditions; between group effect p = 0.02.