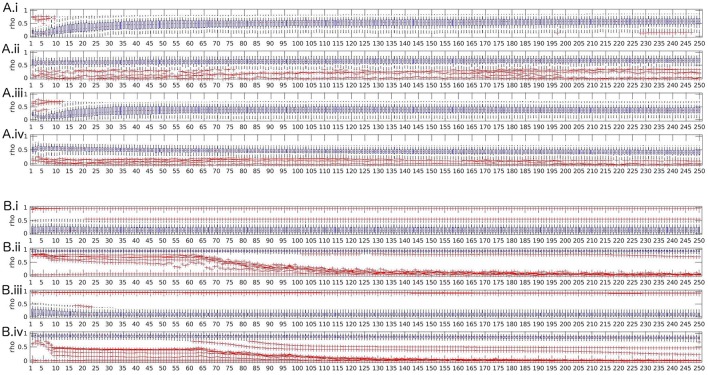
Figure 4.
Boxplots of test-retest reliabilities vs. model order for for directed transfer function (A) and real valued coherence (B). (i) top row: complete data (with artifacts), with frequency averaging; (ii) second row: artifact-free data, with frequency averaging; (iii) third row: complete data without frequency averaging; (iv) bottom row: artifact-free data, without frequency averaging.

