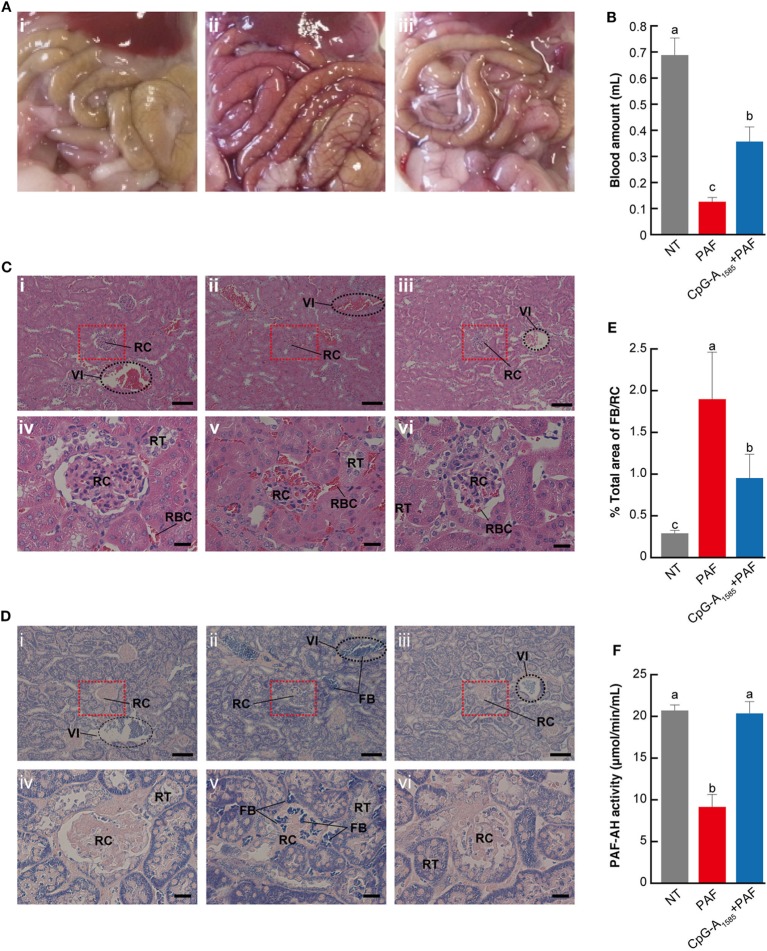
Figure 3.
Mechanism of platelet-activating factor (PAF)-induced lethal shock ameliorated by CpG-A1585. ICR mice were injected with 300 µg CpG-A1585 for 1, 3, and 5 days before receiving 50 µg PAF containing 0.1% human serum albumin. Mice were then euthanized within 10 min after PAF injection. (A) Representative image of the abdominal cavity of (i) non-treated (NT), (ii) PAF-treated, and (iii) CpG-A1585 + PAF-treated mice. (B) Heart blood volume. (C) Hematoxylin-eosin staining, which shows polycythemia and morphological changes in the kidney. (i) NT, (ii) PAF-treated, and (iii) CpG-A1585 + PAF-treated mice. Scale bar = 100 μm. (iv) NT, (v) PAF-treated, and (vi) CpG-A1585 + PAF-treated mice. Scale bar = 20 μm. Fibrin thrombus is stained dark red. (D) Phosphotungstic acid hematoxylin staining, which shows fibrin accumulation in the kidney. (i) NT, (ii) PAF-treated, and (iii) CpG-A1585 + PAF-treated mice. Scale bar = 100 μm. (iv) NT, (v) PAF-treated, and (vi) CpG-A1585 + PAF-treated mice. Scale bar = 20 μm. Fibrin is stained dark blue. FB, fibrin; RBC, red blood cell; RC, renal corpuscle; RT, renal tubule; VI, interlobar veins. (E) The area of fibrin accumulation was determined by Image Processing Software, and the results are presented as the mean ± SE (N = 9 samples per group). (F) Serum platelet-activating factor acetylhydrolase (PAF-AH) activity in mice. N = 8 mice per group. Data are presented as the mean ± SE. Values with different letters (i.e., a, b, and c) represent significant differences (p < 0.05).

