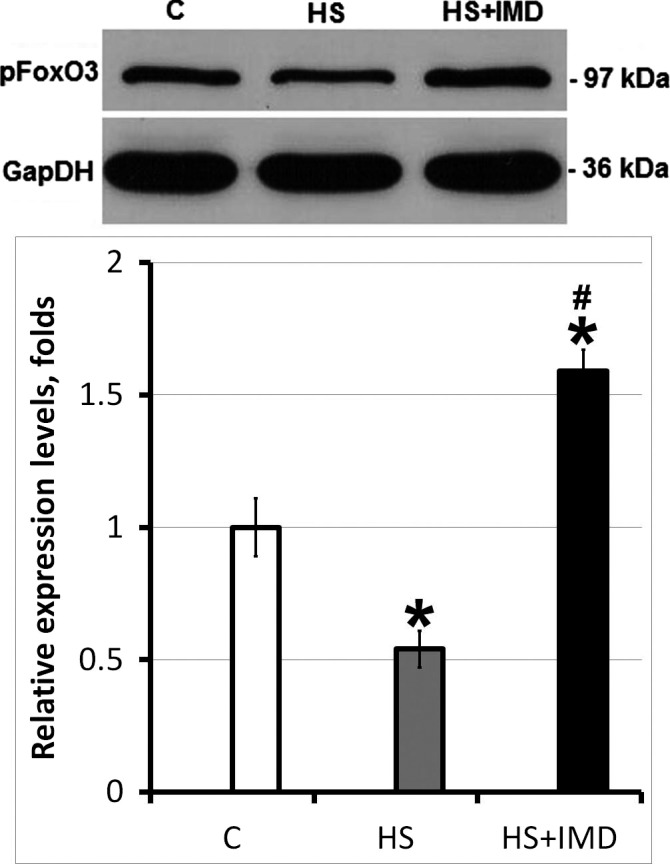
Figure 4.

Evaluation of pFoxO3 protein level in soleus muscles of C, HS, and HS+IMD rats by Western blotting. Values are normalized to the levels of total protein and GAPDH in each sample. N = 7. * indicates a significant difference from control, P < 0.05; # indicates a significant difference from HS, P < 0.05. Western blot image was cropped to display a single band with predicted molecular weight that was identified in our experiments. The same anti‐pFoxO3 antibody was used in previous publications (Kukreti et al. 2013; Tarrado‐Castellarnau et al. 2015).
