
Figure 2.
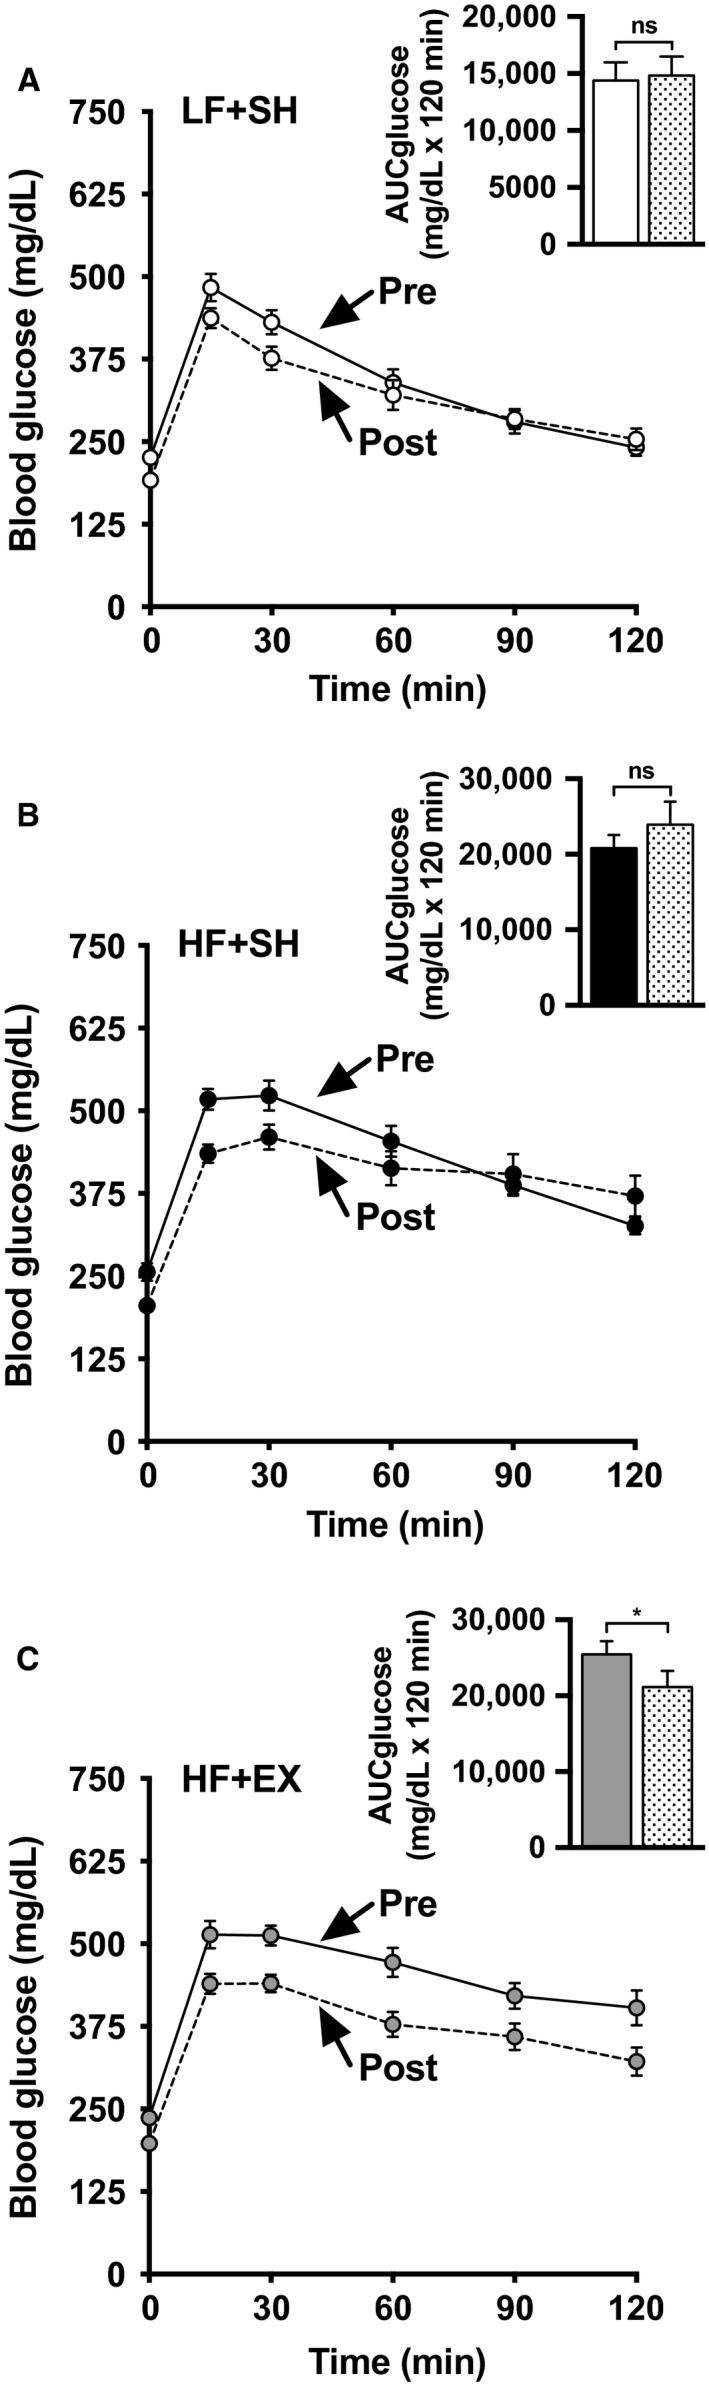
Pre‐ and post‐SH/EX intervention glucose tolerance was determined at 5‐ or 8‐ weeks, respectively, for LF‐ (A), or HF‐ (B,C) fed mice. Blood glucose was measured before and after injection of 2 g glucose/kg body mass. All values are means ± SEM from 17 LF + SH, 17 HF + SH, and 17 HF + EX mice. AUC differences were determined using a paired two‐tailed Student's t test and statistic indicated with ns P > 0.05; *P < 0.05. Solid and hatched bars represent pre‐ and post‐SH/EX interventions, respectively. Note some error bars are shorter than the symbols.