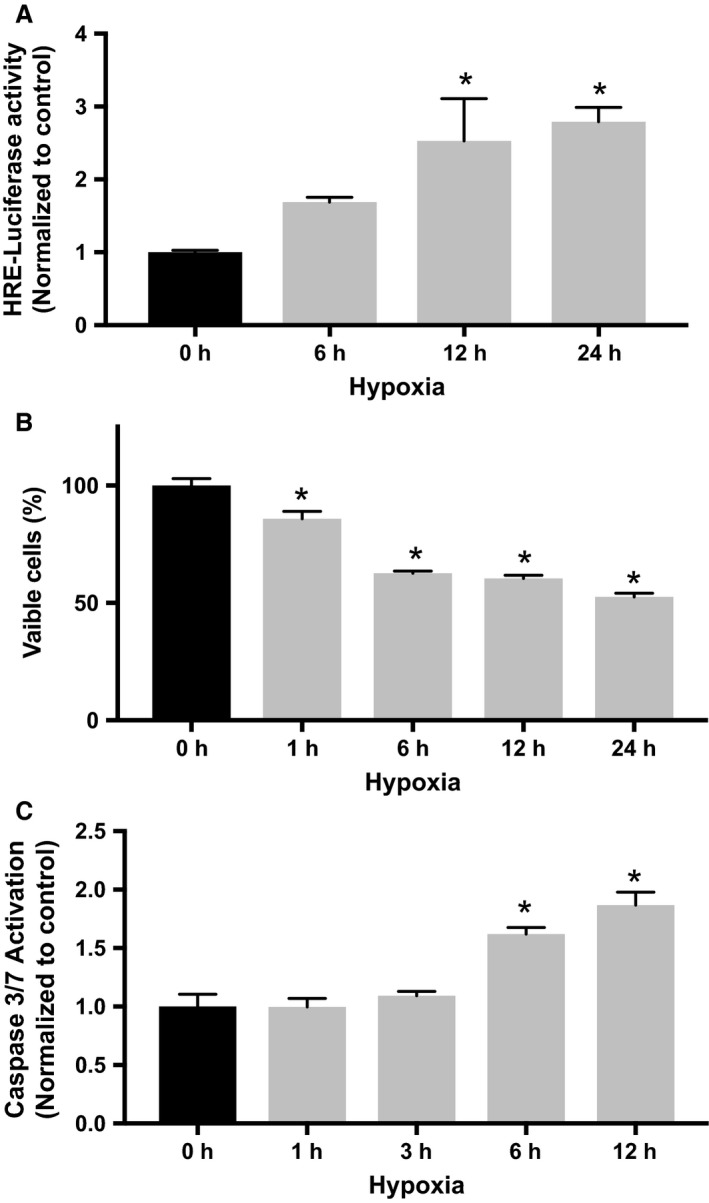
Figure 1.

Validation of RNCM hypoxia model. (A) RNCMs transduced with AdV‐HRE luciferase were incubated in low‐oxygen conditions (<1% O2). HIF‐1 transcriptional activity, quantified by luciferase activity measure, increased as a function of incubation time spent in hypoxia. An “*” denotes a statistically significant difference compared with control. Data represent mean ± SEM (n = 4, ANOVA, P < 0.05, Tukey's test). (B) Cellular viability was assessed as described in Materials and Methods. A significant decrease in viability was detected after 1 hour of incubation in hypoxia. An “*” denotes a statistically significant difference compared with control. Data represent mean ± SEM (n = 4, ANOVA, P < 0.05, Tukey's test). (C) Apoptosis was quantified by measuring Caspase 3/7 activity. A significant increase in caspase activity was detected after 6 h of incubation in hypoxia. An “*” denotes a statistically significant difference compared with control. Data represent ± SEM (n = 3, ANOVA, P < 0.05, Tukey's test).
