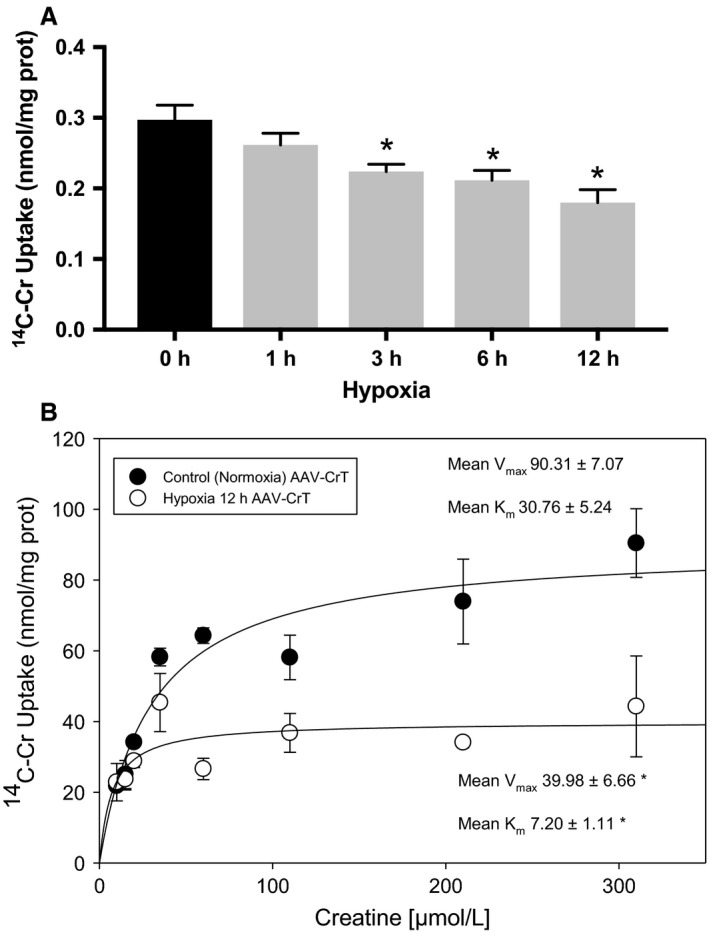
Figure 2.

Hypoxia decreases Cr transport in RNCMs. (A) 14C‐Cr uptake was measured in RNCM cultures grown in a hypoxic atmosphere (<1% O2) for increasing periods of time. The data present the mean ± SEM of four independent 14C‐Cr uptake experiments. An “*” denotes a statistically significant decrease in transport compared with control cells (ANOVA, P < 0.05, Tukey's test). (B) A representative plot of Cr transport measured as a function of variable Cr concentrations (5–305 μmol/L) is depicted. Kinetic analysis was performed as described in Materials and Methods for RNCMs in control conditions (filled circles) or after 12 h of hypoxia (hollow circles). Denoted V max and K m values are mean ± SEM. An “*” denotes a statistically significant difference compared with control normoxia values (n = 3, T‐test, P < 0.05).
