Figure 4.

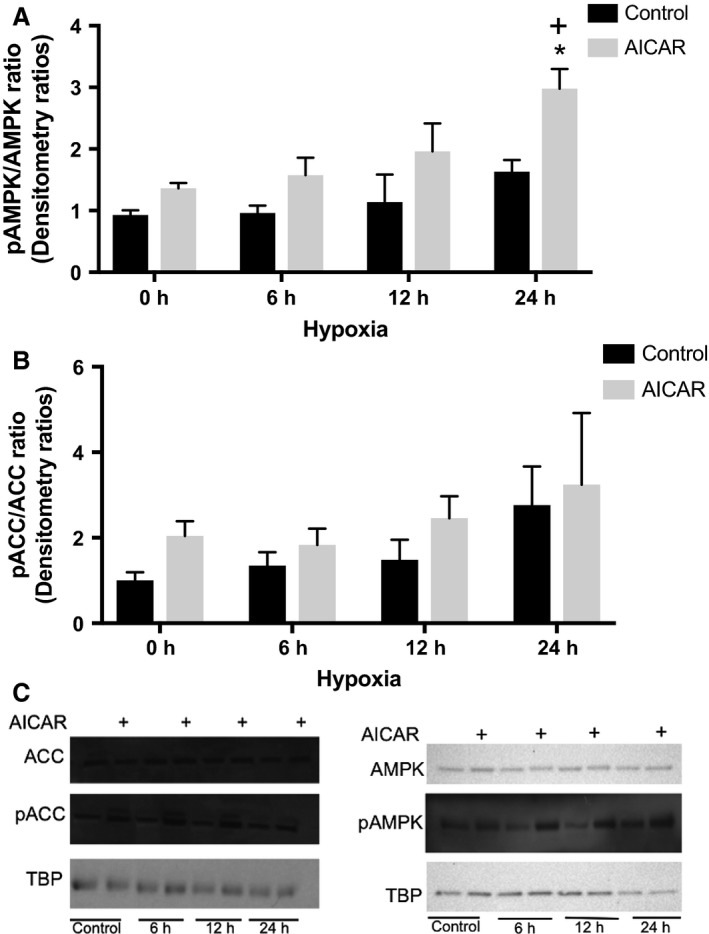
Quantification of AMPK activity in response to AICAR and/or hypoxia. (A) RNCM cultures were pretreated with or without 0.5 mmol/L AICAR for 24 h before exposure to hypoxia for the indicated time periods. The ratio of pAMPK/AMPK was determined using densitometry as described in Materials and Methods. Each bar represents means ± SEM of three independent experiments, normalized to control. An “*” denotes statistically significant difference compared with control at 0 h, and a “+” denotes statistically significant difference compared with AICAR at 0 h (two‐way ANOVA, P < 0.05, Tukey's test). (B) The pACC/ACC ratio was determined using densitometry as described in Materials and Methods. Each bar represents the mean ± SEM of three independent experiments (two‐way ANOVA, P = ns). (C) Representative immunoblots of pAMPK and pACC. TATA binding protein (TBP) was used as a loading control.
