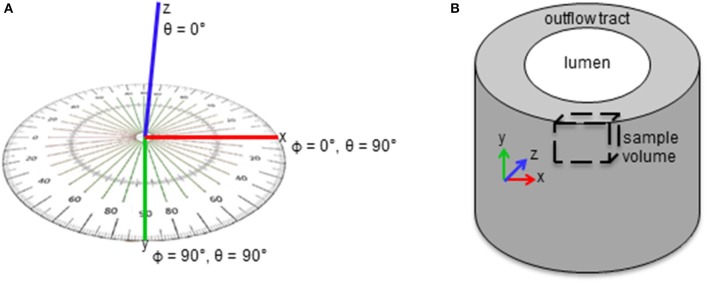
Figure 1.
Schematics of myofibril bundle orientation quantification. (A) Angles ϕ and θ were measured for each bundle. (A) ϕ and θ are the angles of the fibril bundle in the xy and xz planes in the sample volume, respectively. (B) ϕ and θ describe the bundle orientation in the circumferential and radial planes of the outflow tract, respectively.

