Figure 2.
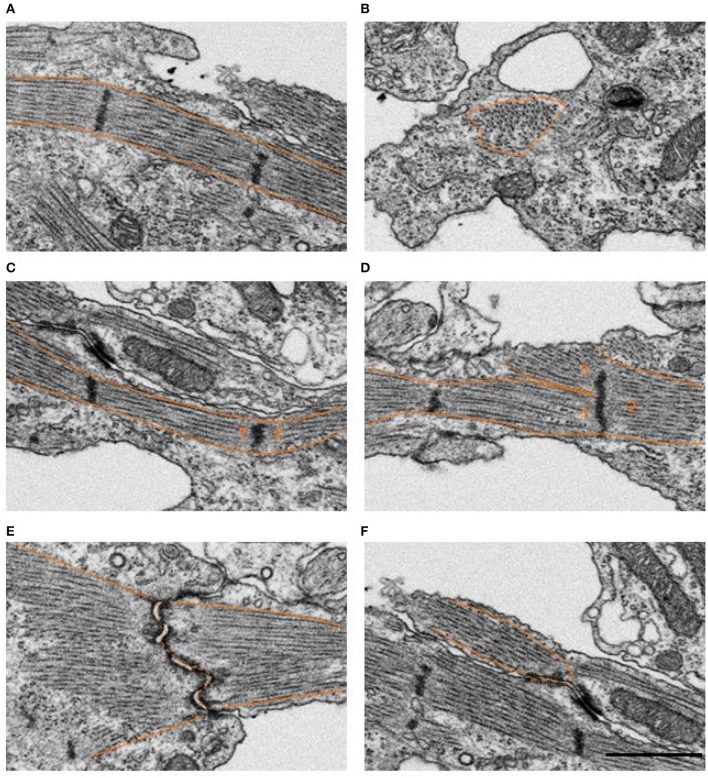
Example FIB-SEM image showing myofibrils in control outflow tract myocardium tissue. Several myofibril orientations are displayed, where the tissue mostly consisted of longitudinally oriented bundles arranged circumferentially around the outflow tract (A) compared to less frequent radially oriented bundles (B). The majority of z-bands only had a single myofibril bundle extending from either side (C), however, samples also contained a few examples of an immature configuration where 3 or more fibril bundles radiated from the same z-band center (D), as numbered above. Most myofibrils inserted into intercalated disks at nearly right angles as they do in mature tissue (E), while some oblique insertions were still visible in control tissue (F). Scale bar = 1 μm.

