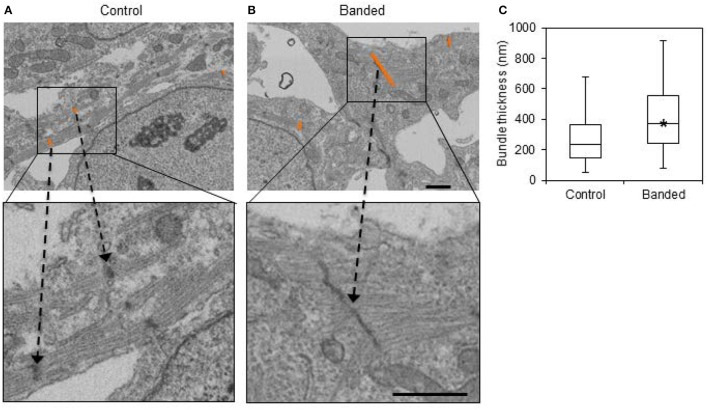
Figure 6.
Example FIB-SEM images from a control (A) and a banded (B) embryo, with example bundle thickness measurement lengths at z-bands shown in orange. (C) Bundle thickness quantification box plots displaying the average, with boxes that mark the upper and lower quartiles and whiskers that mark the maximum and minimum values. The asterisk designates a significantly higher bundle thickness average in banded samples compared to controls (p < 0.05, n = 3). Scale bar = 1 μm.

