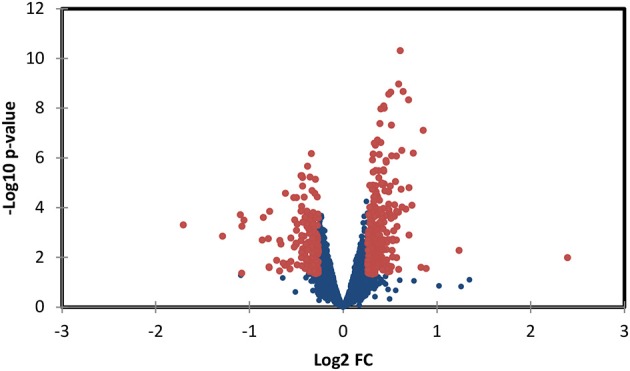
Figure 7.

Volcano plot of proteomics data, depicting protein data p-values vs. fold change (FC). Red points represent data points with p < 0.05 and a fold rate >1.2; proteins associated with these points are listed in the supplementary file “Data Sheet 3.”
