Fig. 1.

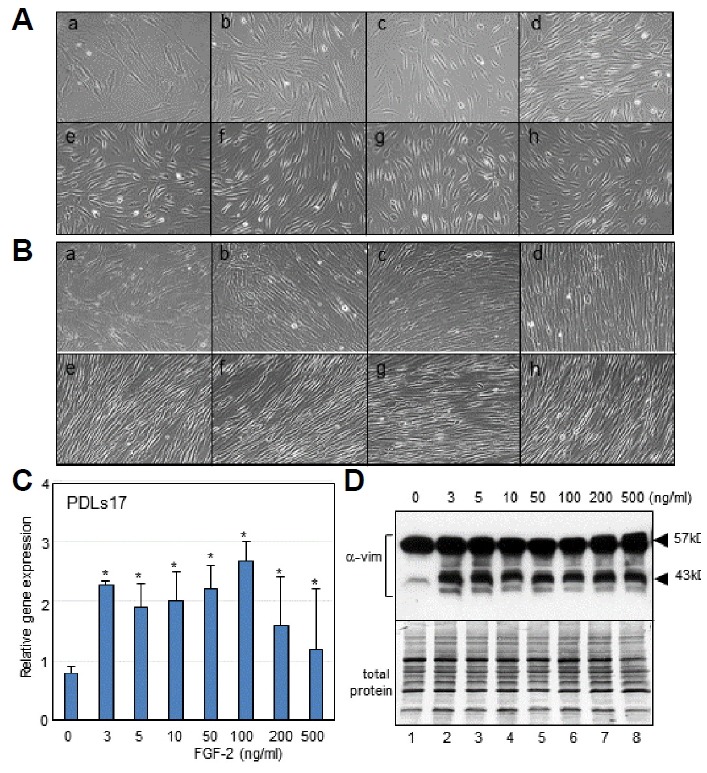
FGF-2 treatment induces and maintains the fibroblastic feature in hPDLSCs.
(A, B) Cellular phenotypes of hPDLSCs treated with various concentration of FGF-2 in low density of cell culture (A) and in confluent culture (B). (a), no treatment; (b), 3 ng/ml; (c), 5 ng/ml; (d), 10 ng/ml; (e), 50 ng/ml; (f), 100 ng/ml; (g), 200 ng/ml; (h), 500 ng/ml. (C) Evaluation of mRNA expression of PDLs17 by qRT-PCR. Significant differences from statistical analysis were indicated as *P < 0.01 versus 0 ng/ml. (D) Evaluation of vimentin expression by western analysis. Endogenous vimentin was detected as multiple bands on SDS-PAGE of 43–57 kDa (α-vim). Used protein amount was indicated in lower panel (total protein).
