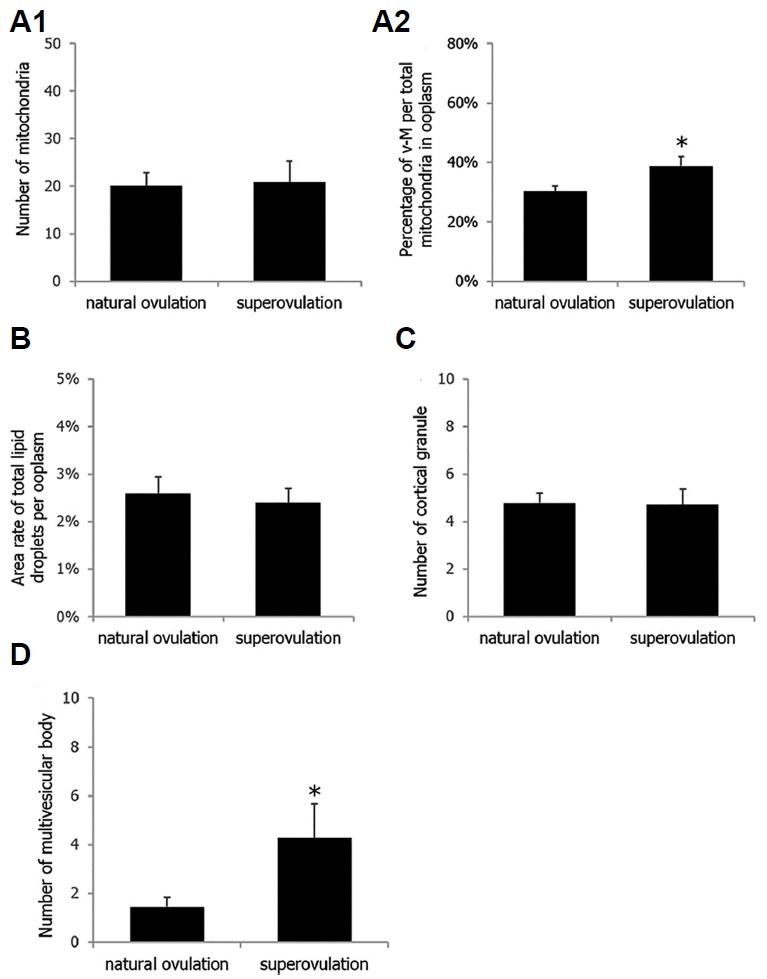
Fig. 2.

Differences in the number of microorganelles in mature (metaphase II stage) oocytes retrieved after superovulation treatment or natural ovulation.
For numerical comparison, number of mitochondria per 100 μm2 of ooplasm (A1), percentage of vacuolated-mitochondria per total mitochondria in 100 μm2 of ooplasm (A2), percentage of total lipid droplets per 100 μm2 of ooplasm (B), number of cortical granules per 10 μm of oolemma (C), and number of multivesicular bodies per 200 μm2 of ooplasm (D) were counted. Statistical comparison employing PLOC-GLM model was conducted with numerical values and data are presented as mean ± SE. *Statistical siginficance in A2 (p = 0.0186) and D (p = 0.0221)
