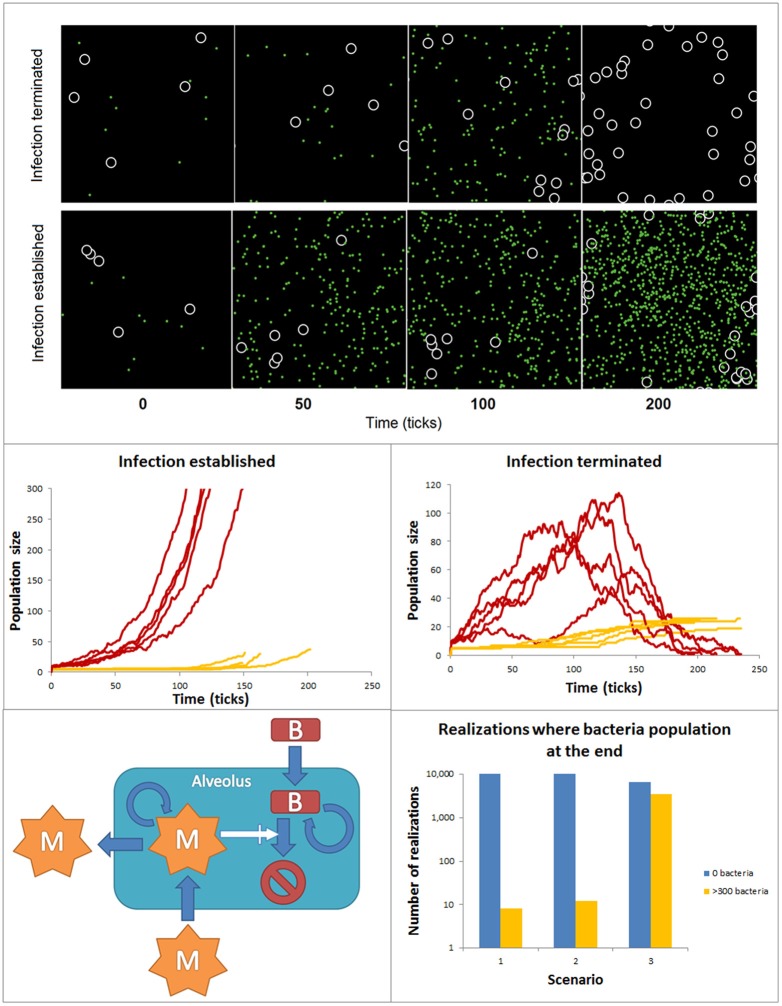
Figure 6.
ABM accounting for the spatial features of bacteria and macrophage dynamics during early phases of lung alveolus infection. Top: Time course for bacteria and macrophage populations predicted by the ABM for simulations similarly initiated but reproducing infection resolution (top) and infection establishment (bottom). The black space represents an alveolus, white circles are macrophages and green dots are bacteria. Both populations can freely move within the alveolus. Center: 10 similarly initiated ABM simulations are classify into those accounting for infection successfully established (left) and those representing infection resolved (right). Red lines represent bacteria populations and yellow lines macrophage population. Bottom: ensembles of ABM simulations used to assess the relative importance of the processes modeled in the simulation output. 104 simulations were implemented for each scenario. The solutions were divided into two groups (a) yellow bar: solutions ending in an establishment of bacterial infection [bacteria (ti) ≥ 300): and (b) blue bar: solutions ending with depletion of the bacteria population (bacteria (tfinal) = 0].

