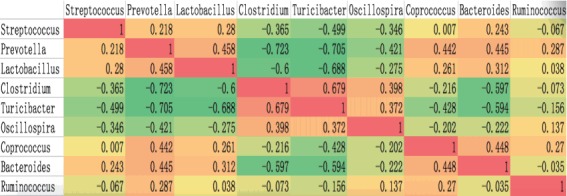
Figure 3.

Co-occurrence patterns among the nine core bacteria across the 23 samples as determined by Spearman’s rank correlation analysis. The correlation coefficient (r) indicates the extent to which the two genera co-occur. The different colors represent the range of (r) from −1 to +1. Orange indicates a perfect positive correlation, whereas green indicates a perfect negative correlation.
