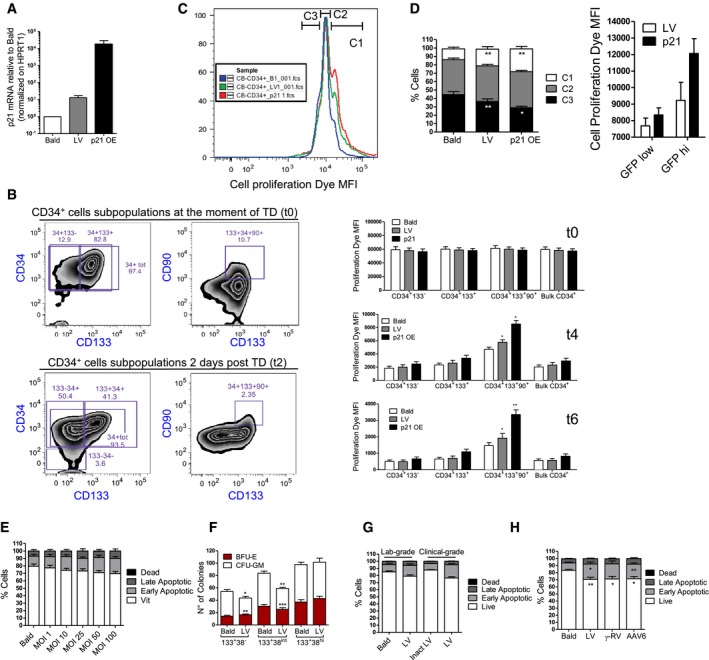
Figure EV2. In vitro impact of LV.

-
Ap21 expression levels 48 h after the transduction of human CB‐CD34+ exposed to an MOI of 100 PGK‐GFP SIN LV (LV), p21 overexpressing LV (p21 OE) or p24 equivalent of Bald (mean ± SEM, n = 8).
-
BRepresentative gating strategy to analyze the CD34+ cells treated as in Fig 2A. The upper panel shows the percentage of CD34+, CD133+, and CD90+ cells at the moment of transduction, the lower panel reports the same markers 2 days after the transduction. In the right panels, the bar graphs show the MFI of the cell proliferation dye at the moment of transduction or 4 and 6 days after the transduction within each subpopulation (mean ± SEM, n = 8, Wilcoxon matched pairs test, *P = 0.0313 for t4, *P = 0.0156 and **P = 0.0078 for t6).
-
C, D(C) Representative histograms and (D) bar graphs of cells treated as in Fig 2A at 2 days after transduction. The analyses were performed to assess the percentage of CB‐CD34+ cells that are contained within each gate (C1, C2, C3) for LV, p21, and Bald conditions. The cells within the C1 gate have proliferated less, while the one in the C3 have proliferated more (mean ± SEM, n = 8, Wilcoxon signed‐rank test, *P = 0.0142, **P = 0.0078, left panel) (mean ± SEM, n = 6, right panel).
-
EAnnexin V staining for apoptotic cells was performed 2 days after transduction of human CB‐CD34+ exposed to increasing MOI of PGK‐GFP SIN LV (LV) (mean ± SEM, n = 6).
-
FAfter the sorting and transduction as indicated in Fig 1F, CB‐CD34+ cells were plated in semisolid, cytokine‐containing CFC medium. Colonies were scored after 14 days (mean ± SEM, n = 4, Wilcoxon signed‐rank test, *P = 0.0416, **P = 0.0078 in 133+38−, **P = 0.0011 in 133+38int, ***P = 0.004).
-
G, HAnnexin staining for apoptotic cells was performed 2 days after transduction of human CB‐CD34+ exposed to an MOI of 100 PGK‐GFP SIN LV (LV), MOI of 100 clinical‐grade LV (clinical LV), MOI 10,000 of AAV6 and MOI 100 of PGK‐GFP SINRV (RV) or to p24 equivalent of Env‐less (Bald) or inactivated clinical LV as controls (Inactivated clinical LV) (mean ± SEM, n = 3, G), (mean ± SEM, n = 11 for Bald, LV and AAV6, n = 7 for RV, Dunn's adjusted Kruskal–Wallis test, *P ≤ 0.05; **P ≤ 0.01, H).
