
Figure 1. Differential gene expression profiles in inflammatory monocytes sorted from the bone marrow, blood, and heart were found 3 days after MI.
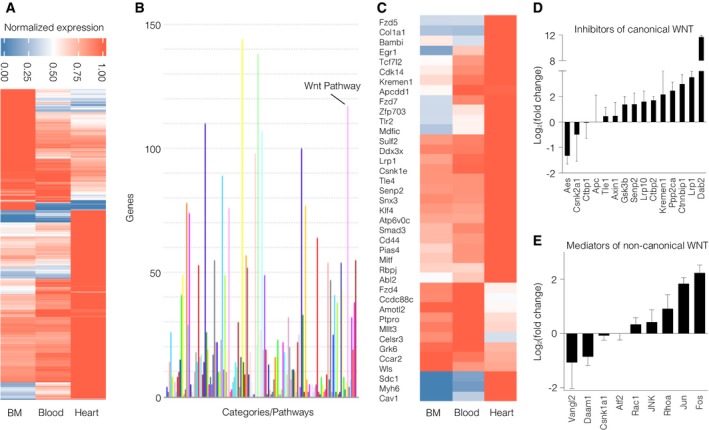
- RNA‐seq analyses revealed differential expression of 1,482 genes in monocytes sorted from different bodily regions.
- PANTHER pathway analysis of genes found in the transcriptomes.
- Differential gene expression of WNT‐associated genes in monocytes.
- Log2(x‐fold) of canonical WNT pathway inhibitors in Ly6Chi monocytes sorted from the heart compared to Ly6Chi monocytes in the bone marrow. Data are represented as mean ± SD (N = 3).
- Log2(x‐fold) of non‐canonical WNT/PCP pathway mediators in Ly6Chi monocytes sorted from the heart compared to Ly6Chi monocytes in the bone marrow. Data are represented as mean ± SD (N = 3).