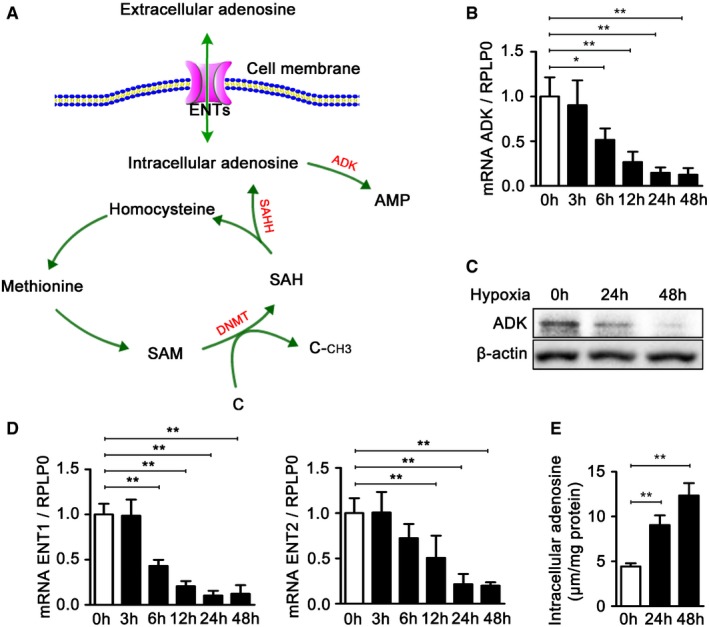
Figure 1. Decreased ADK expression and increased level of intracellular adenosine in endothelial cells upon hypoxia.

- Biochemistry of the transmethylation reaction.
- Real‐time PCR analysis of ADK mRNA levels in HUVECs exposed to hypoxia for the indicated time periods. Results are from four independent experiments.
- Western blot analysis of ADK expression in HUVECs exposed to hypoxia for the indicated time periods. Images are representative from three independent experiments.
- Real‐time PCR analysis of ENT1 and ENT2 mRNA levels in HUVECs exposed to hypoxia for the indicated time periods. Results are from four independent experiments.
- Quantification of intracellular adenosine by high‐performance liquid chromatography (HPLC) in HUVECs exposed to hypoxia for the indicated time periods. Results are from four independent experiments.
