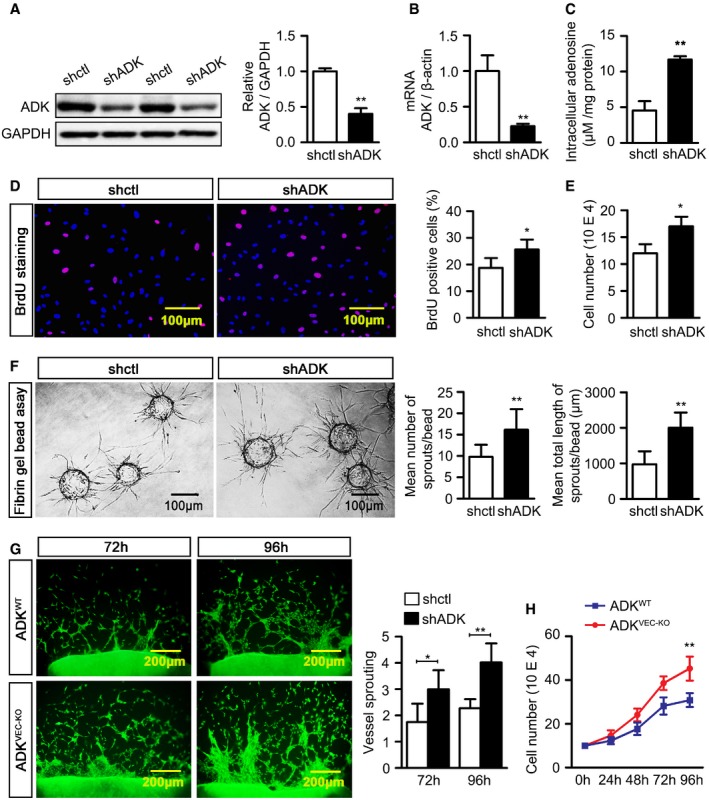
Western blot analysis of ADK expression in control (shctl) and ADK KD (shADK) HUVECs. Results are from three independent experiments.
Real‐time PCR analysis of ADK mRNA levels in shctl and shADK HUVECs. Results are from three independent experiments.
Quantification of intracellular adenosine in HUVECs by HPLC. Results are from three independent experiments.
BrdU staining of proliferating HUVECs. Results are from four independent experiments.
Cell numbers of HUVECs grown for 24 h. Results are from three independent experiments.
Representative images of sprouting assay with fibrin gel and quantification of sprout numbers and sprout length (n = 30 beads per group).
Representative images and quantification of endothelial cell outgrowth on days 3 and 4 after murine aortic rings were placed on collagen gel. Results are obtained from eight aortic rings isolated from four mice for each group.
Number of MAECs from ADKWT and ADKVEC‐KD mice grown in complete growth medium for 0, 24, 48, 72, and 96 h. Results are from four independent experiments.
Data information: For all bar graphs, data are the mean ± SD, *
P <
0.05 and **
P <
0.01 for the indicated comparisons; unpaired, two‐tailed Student's
t‐test for (A–F); two‐way ANOVA with Bonferroni's
post‐hoc test for (G and H). The exact
P‐values are specified in
Appendix Table S1.
Source data are available online for this figure.

