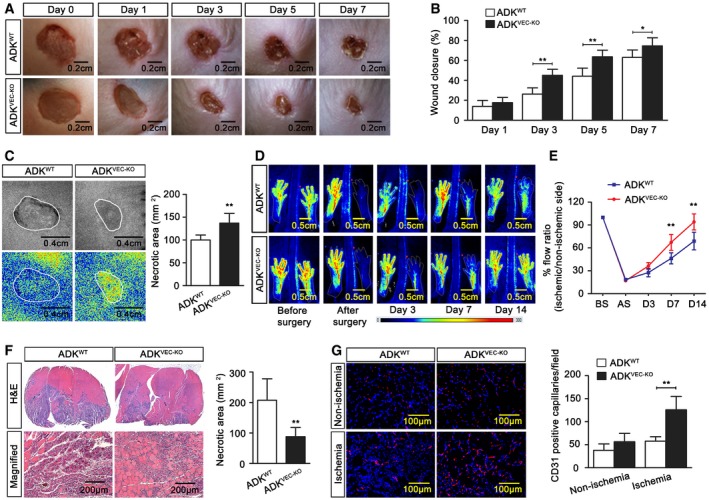
Representative images of mouse wound healing at different days after skin punch biopsy.
Quantification of murine wound area at different time points after injury (n = 7 mice per group).
Laser speckle contrast imaging and quantification of blood perfusion in murine wounds at day 3 after wounding (n = 7 mice per group).
Representative laser Doppler perfusion images of mice following unilateral hindlimb ischemia at various days after surgery.
Time course of blood perfusion rate examined with computer‐assisted analysis of laser Doppler program (n = 7 mice per group).
Histological examination of necrotic area in gastrocnemius (GC) muscle at day 7 after ischemia (n = 7 mice per group).
Representative images and quantification of immunofluorescence staining of CD31 on sections of GC muscle at day 7 after ischemia (n = 7 mice per group).
Data information: For all bar graphs, data are the means ± SD, *
P <
0.05, and **
P <
0.01 for ADK
VEC‐KD vs. ADK
WT; two‐way ANOVA with Bonferroni's
post‐hoc test for (B and E); unpaired, two‐tailed Student's
t‐test for (C, F and G). The exact
P‐values are specified in
Appendix Table S1.

