-
A
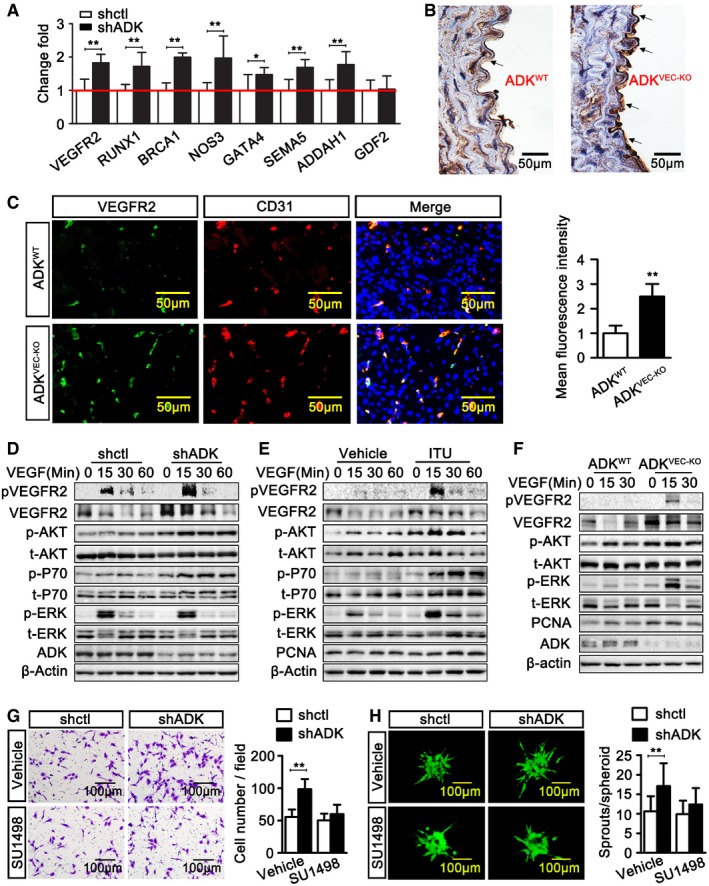
Real‐time PCR analysis of angiogenic gene expression in control and ADK KD HUVECs. Results are from four independent experiments.
-
B
Representative images of VEGFR2 immunohistochemical staining on aortic sections of ADKWT and ADKVEC‐KD mice (n = 3 mice per group). The arrows indicate VEGFR2‐positive areas.
-
C
Immunofluorescent staining analysis of CD31 and VEGFR2 on sections of GC muscle at day 7 after hindlimb ischemia (n = 7 mice per group).
-
D–F
Confluent serum‐starved cells were incubated with VEGF‐A at 50 ng/ml. Western blot analysis of VEGFR2, Akt, P70, ERK, and their phosphorylated forms in: (D) control and ADK KD HUVECs, (E) vehicle and 5‐iodotubercidin (ITU)‐treated HUVECs, or (F) MAECs. Images are representative from three independent experiments.
-
G
Endothelial migration in control and ADK KD HUVECs treated with or without SU1498 at 1 μM and cultured in a transwell plate for 16 h. Results are from four independent experiments.
-
H
Endothelial sprouting of control and ADK KD HUVECs treated with or without SU1498 at 1 μM in a spheroid assay (n = 10 spheroids per group).
Data information: For all bar graphs, data are the means ± SD, *
P <
0.05, and **
P <
0.01; unpaired, two‐tailed Student's
t‐test for (A and C); one‐way ANOVA with Tukey's
post‐hoc test for (G and H). The exact
P‐values are specified in
Appendix Table S1.
Source data are available online for this figure.

