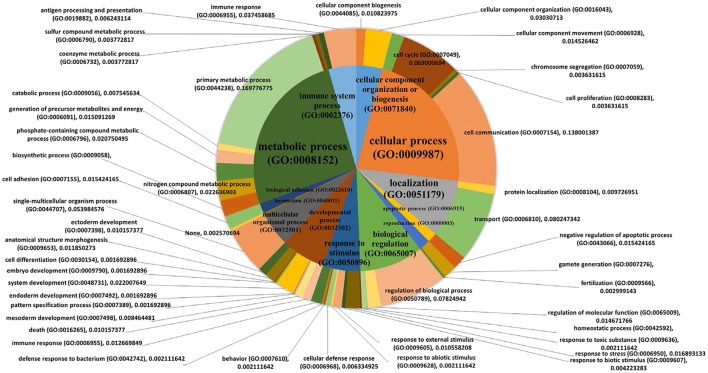
Figure 5.
Pie charts showing biological processes. PANTHER biological pathway analysis was used with 411 genes that were significantly correlated with the MWM performance (p < 0.050 and |r| ≥ 0.5, Table 1). The 1st order of sub biological processes was drawn as a small pie chart in the center of the main biological process pie chart.

