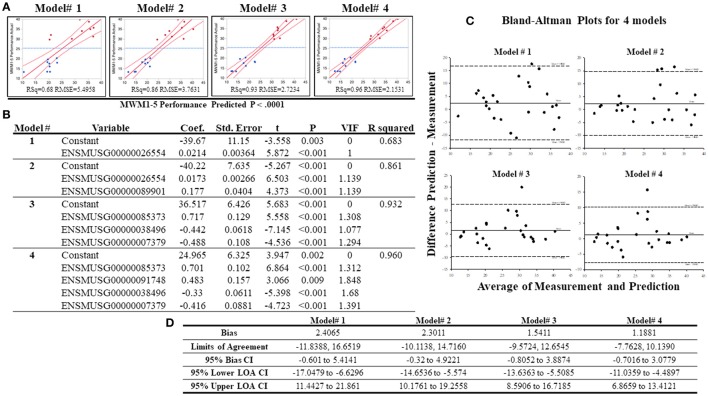
Figure 8.
Results of the best subset regression analysis. Four acceptable regression models (A) for mouse MWM1-5days performance were identified and are shown here with a regression line (solid red line) and confidence of fit curves (curved red dot lines). Blue dashed lines are the mean of the MWM performance for the 5 days (MWM1-5 performance). Statistical information for the 4 regression models are shown on (B). Bland-Altman Plots with 18 samples in the low and high groups in addition to 7 additional samples (total n = 25). (C) highlights the center lines represent bias of each model and upper and lower dot lines are 95% upper and lower limits of agreements. (D) shows statistical information of Bland-Altman Plots for acceptable 4 regression models created by the best subset regression analysis.

