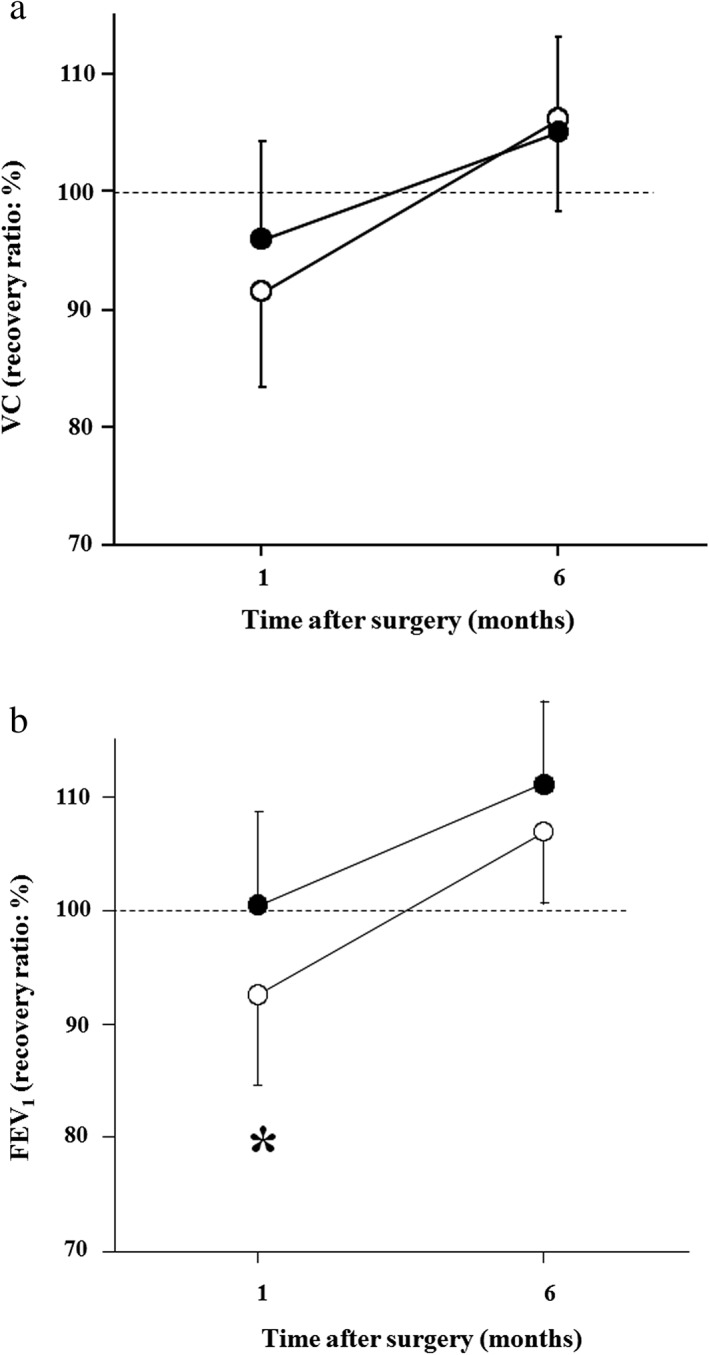
Figure 3.

The recovery rate of (a) vital capacity (VC) and (b) forced expiratory volume in one second (FEV 1) one and six months after pulmonary lobectomy in the pulmonary rehabilitation (PR) (closed circles) and non‐PR groups (open circles). The Y‐axis shows the recovery rate as expressed by measured postoperative value/predicted postoperative value × 100 (%). Values are expressed as means ± standard deviation. *P < 0.05 versus PR.
