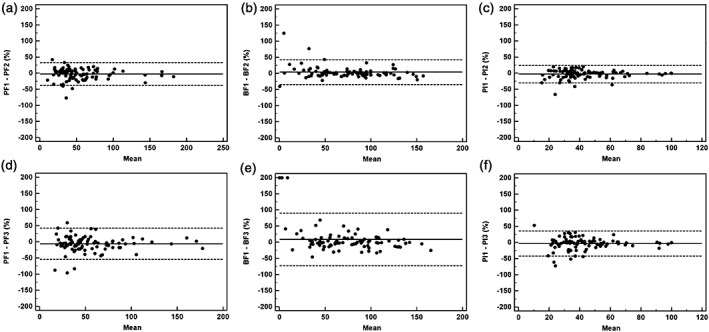
Figure 2.

Intra‐observer and inter‐observer agreements using Bland–Altman plots for all lung cancers (n = 88) measured by two different observers. The solid line shows the mean value, where the mean = (value 1 + value 2)/2. The dashed lines denote the means ± (1.96 × standard deviation). Ordinate value = ([value 1 − value 2]/mean) × 100. Pulmonary flow (PF) 1, 2, 3 = PF measured by observer 1 the first time, observer 1 the second time, and observer 2, respectively. The same process applies to bronchial flow (BF) 1, 2, 3 and perfusion index (PI) 1, 2, 3. Graphs show Bland–Altman plots for (a) PF, (b) BF, and (c) PI values measured by observer 1 and (d) PF, (e) BF, and (f) PI values measured between observers 1 and 2.
