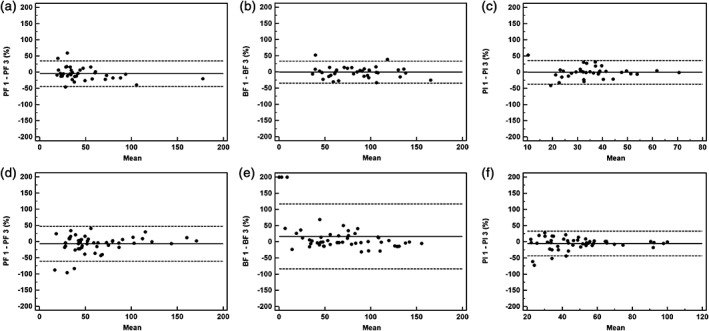
Figure 3.

Interobserver agreement using Bland–Altman plots for masses (n = 37) and nodules (n = 53) measured by two different observers. The solid line shows the mean value, where the mean = (value 1 + value 2)/2. The dashed lines denote the means ± (1.96 × standard deviation). Ordinate value = ([value 1 − value 2]/mean) × 100. Pulmonary flow (PF) 1 = PF measured by observer 1, PF 3 = PF measured by observer 2. The same process applies to bronchial flow (BF) 1, BF 3, and perfusion index (PI) 1, PI 3. Graphs show Bland–Altman plots for (a) PF, (b) BF, and (c) PI values for lung masses and (d) PF, (e) BF and (f) PI values for lung nodules.
