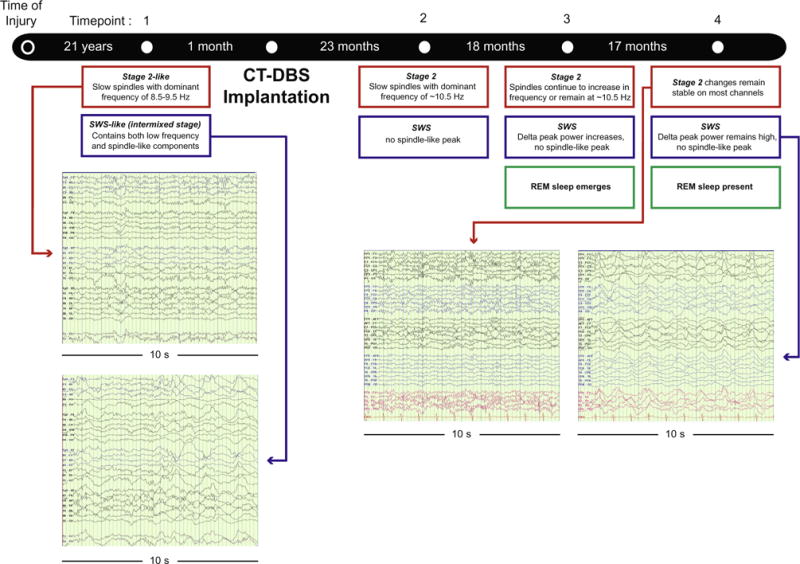
Fig. 1.

Timeline of patient data collection. Study timeline and main findings. 10-s EEG segments are displayed for pre-CT-DBS and post-CT-DBS (TP 4) time points. Left: red arrow designates a “stage 2-like” sleep at the pre-CT-DBS time point, with slow and partially formed spindles. Blue arrow points to a “SWS-like” stage, with the intrusion of stage 2-like elements and slow spindles within slow wave activity. Right: red arrow highlights stage 2 sleep at TP 4 post-CT-DBS containing faster spindling activity. Blue arrow illustrates SWS at TP 4; segments contain increased low frequency activity and fewer stage 2-like elements. See Supplementary Fig. S3 to view power spectra at each time point as described in the blue and red boxes. (For interpretation of the references to colour in this figure legend, the reader is referred to the web version of this article.)
