Fig. 2.

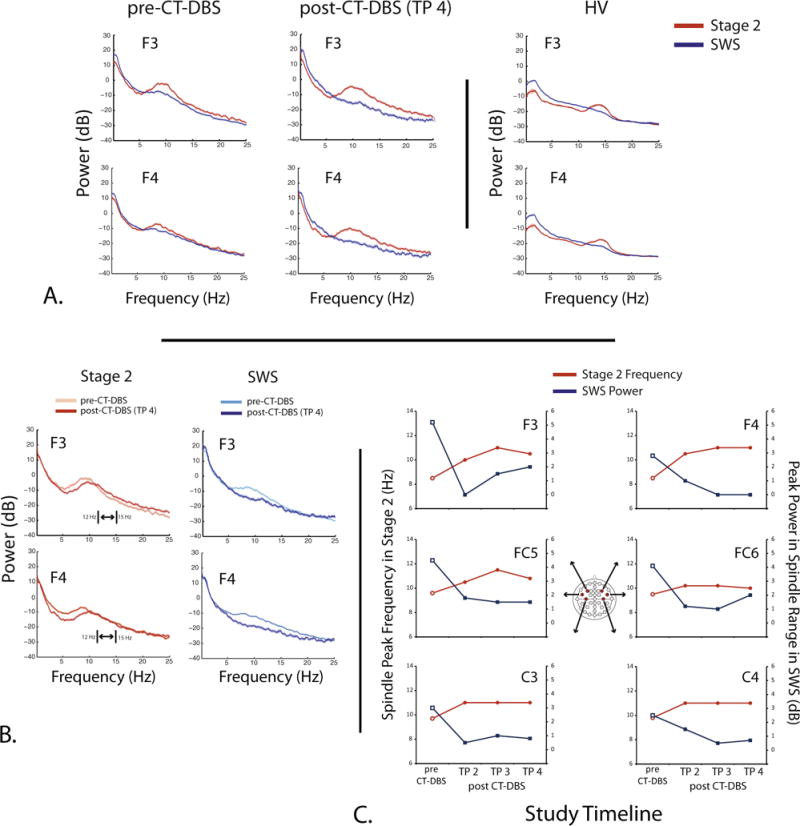
Stage 2 and SWS dynamics pre- and post-CT-DBS in the PS and HV. Examples of representative EEG responses from the PS in comparison with the HV. A: power spectra responses recorded from channels F3 and F4 at two time points (pre-CT-DBS and TP 4 post-CT-DBS) for both stage 2 (red) and SWS (blue) as compared to the HV. B: power spectra from stage 2 (red) and SWS segments (blue) obtained from pre-CT-DBS (light red or blue) and post-CT-DBS (TP 4) (dark red or blue) time points plotted on one axis. Double-headed arrow and brackets denote the lower (12 Hz) and upper (15 Hz) bounds of spindling activity observed in healthy sleep (Mölle et al., 2011). By TP 4, the spindle peak frequency is approaching the lower bound of this range. C: center spindle peak frequency in stage 2 sleep and the peak power in the spindle range in SWS for each study time point across channels F3, F4, FC5, FC6, C3, and C4. These values were determined after normalization using the method from Gottselig et al. (2002) (see Methods). (For interpretation of the references to colour in this figure legend, the reader is referred to the web version of this article.)
