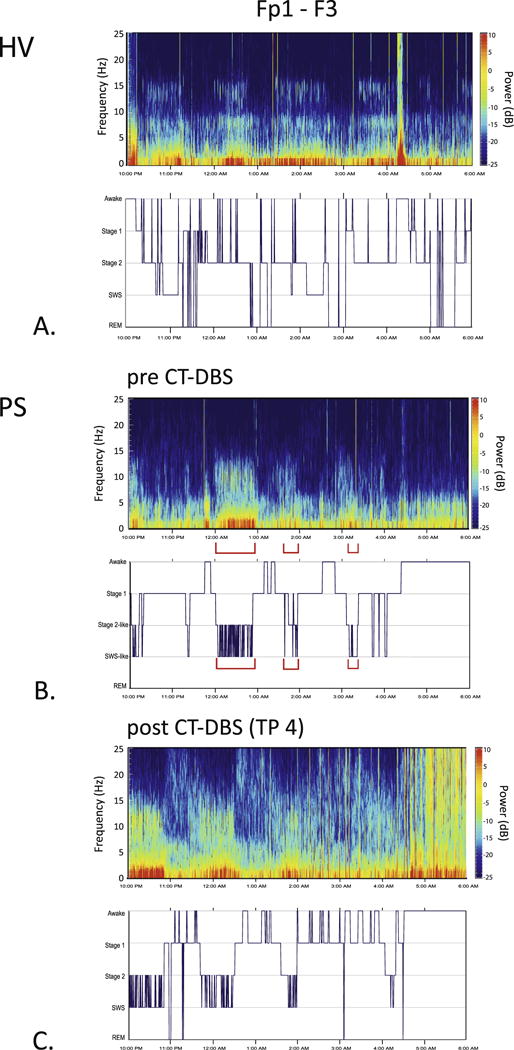
Fig. 3.

Time-varying spectrograms and hypnograms. Time-varying spectrograms and hypnograms were calculated from bipolar channel Fp1-F3 for pre- and post-CT-DBS implantation (TP 4) conditions, and for the HV. In the hypnograms, the x-axis indicates continuous time (10PM to 6AM), and the y-axis indexes sleep stages. A: HV spectrogram and accompanying hypnogram. B: spectrogram and hypnogram from the pre-CT-DBS time point. Red brackets in spectrogram indicate a mixing of stages, with low frequency (delta waves) co-occurring with higher frequency elements (spindle-like peaks). The sleep stage labels in B are denoted as “Stage 2-like” and “SWS-like” to emphasize that isolated stages of sleep were difficult to discern via standard visual scoring. C: At TP 4 post-CT-DBS, more defined stage 2 and SWS dominated the EEG record. However, there were still individual epochs that contained the mixing of sleep features. REM sleep emerged at TP 3 and remained present at TP 4 (Supplementary Fig. S2). (For interpretation of the references to colour in this figure legend, the reader is referred to the web version of this article.)
