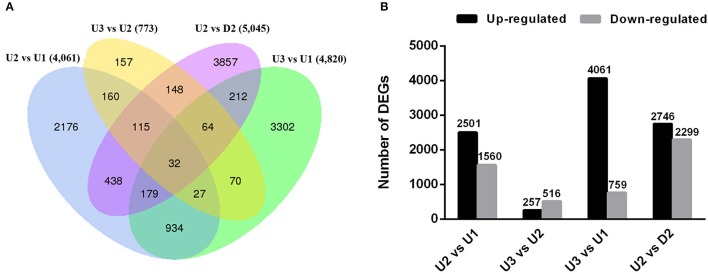
Figure 3.
Overview of numbers of DEGs in pairwise comparisons. (A) Venn diagram of DEGs among the four comparisons performed (U2 vs. U1, U3 vs. U2, U2 vs. D2 and U3 vs. U1). (B) Histogram showing the number of DEGs that were up- or down-regulated between different libraries. The black columns indicate up-regulated DEGs, and the gray columns represent down-regulated DEGs in the four pairwise comparisons.

