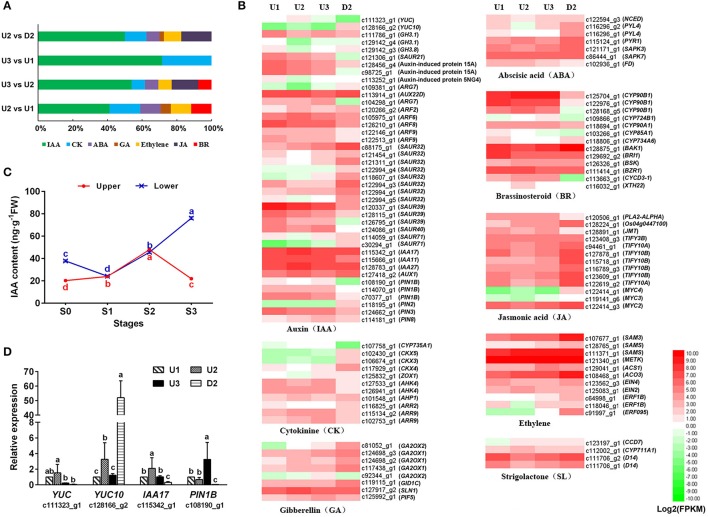
Figure 6.
Regulation patterns of plant hormones during the process of bulbil formation. (A) Distribution of DEGs related to plant hormone signal transduction compared pairwise among the four libraries. (B) Heatmap of the unigenes assigned to hormone synthesis and signal transduction pathways in the four transcriptomes: U1, U2, U3, and D2. The FPKM values of the unigenes were log2 transformed, and a heatmap was generated using HemI 1.0. Red and green indicate up- and down-regulated transcripts, respectively. (C) IAA contents of the upper (red) and lower (blue) axils at different stages during bulbil formation. The representation of the x-axis, y-axis, significance tests and error bars are as described in Figure 5. (D) qRT-PCR analysis of the expression profiles of four genes related to auxin signailing. The representation of the x-axis, y-axis, significance tests and error bars are as described in Figure 4C. Non-overlapping letters (a–d) in (C,D) indicate significant differences (p < 0.05) for between the comparisons of different samples.

