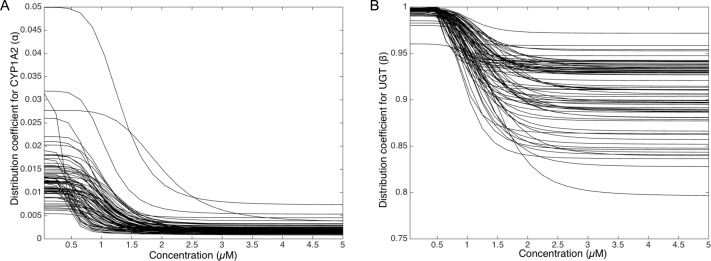
Figure 9. Variation of the CYP1A2 distribution coefficient α (A) and the UGT distribution coefficient β (B) modeled by a sigmoid function of the MeIQx concentration.
All 73 parameterized numerical models which explain the best the transformation of MeIQx into several compounds were built by introducing a MeIQx-dependant distribution coefficient for CYP1A2 and UGT modeled with a sigmoid function. The evolution of this dependency with respect to the concentration of MeIQx is depicted for both enzymes.

