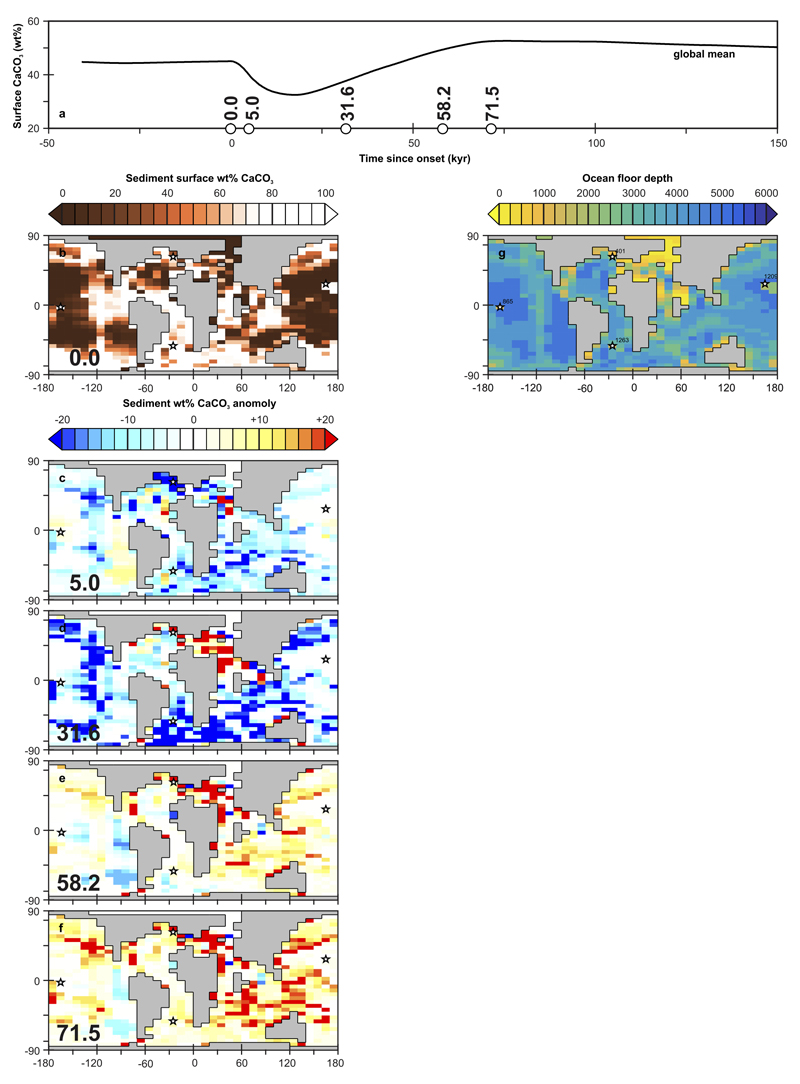
Extended Data Fig. 7. Spatial and temporal evolution of surface sedimentary carbonate content in cGENIE across the PETM.
(a) Global mean surface sedimentary wt% CaCO3 (black solid line) across the PETM from experiment ‘R07sm_Corg’. White circles represent the times from PETM onset onwards that correspond to the δ11B derived pH data points as per in Fig. 3b and Extended Data Fig. 6. Note that the white circles do not represent ‘values’ and are plotted simply as markers of specific time-points (see Extended Data Fig. 6). (b) Model projected spatial pattern of surface sedimentary wt% CaCO3 at time zero (i.e. PETM onset). Shown are the locations of sites for which surface ocean pH has been reconstructed (see Fig. 2) and at which detailed down-core model-data comparison is carried out (Extended Data Fig. 9). (c-f) Model projected spatial pattern of the surface sedimentary wt% CaCO3 anomaly compared to time zero, for the highlighted time-points in (a) – 5.0, 31.6, 58.2, and 71.5 kyr following onset. (g) For reference – the assumed seafloor bathymetry in the model (together with the locations of the four data-rich sites focussed on in the SI analysis).

