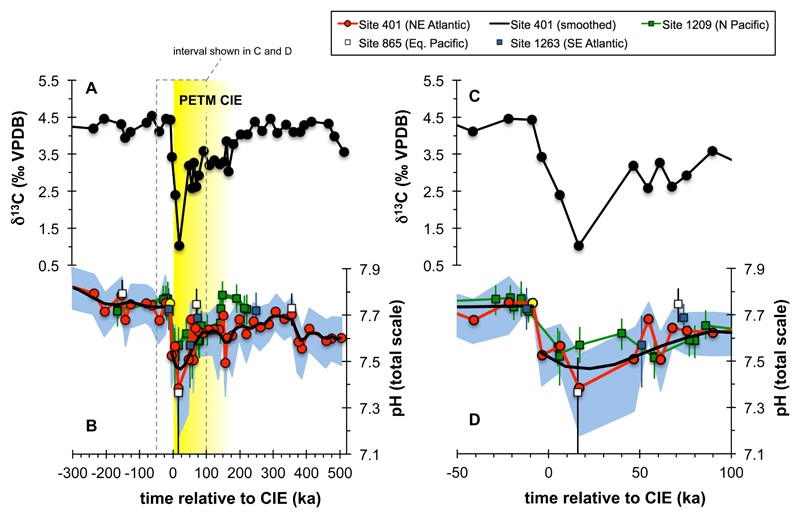
Fig. 2. M. subbotinae based δ13C and boron isotope based pH reconstructions of Site 401.
Panels A and B show the entire record, while C and D focus on the CIE interval. Also shown are data of ref. 20 on the original age model with pH values recalculated using a laboratory offset such that pre-PETM pH calculated using our Monte Carlo approach at Site 1209 = 7.74 given the distribution of seawater δ11B determined at Site 401 (38.9 ± 0.4‰). This resulted in a mean correction of the literature data20 of -0.32‰.

