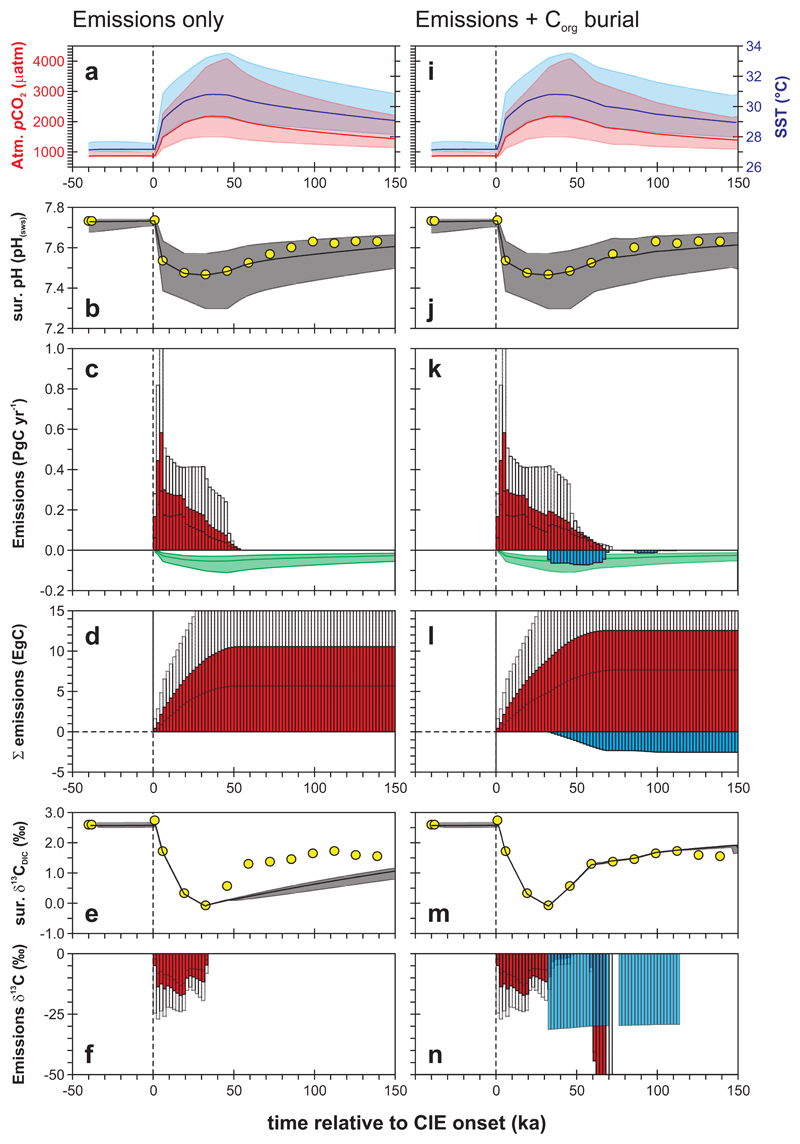
Fig. 3. Results of Earth system model data assimilation.
The right hand panels also account for organic carbon burial during PETM recovery. (a,i) Atmospheric pCO2 (red, LH axis) and mean global SST (blue, RH axis). (b,j) Modelled mean global ocean surface pH (observed smoothed surface ocean pH data as yellow symbols). (c,k) Model diagnosed rates of CO2 release (red) and excess CO2 consumption due to silicate weathering (green) from PETM onset onwards. (d,l) Cumulative CO2 release (red) and organic carbon burial (blue). (e,m) Modelled mean global ocean surface δ13C (observations as yellow symbols). (f,n) Model diagnosed δ13C of the CO2 release (red) and isotopic composition of buried carbon (blue). Shaded bands (a,b,e,i,j,m) and empty bars (c,d,f,k,l,n) reflect 95% uncertainty limits. Bars reflect 2 kyr averaging (c,f,k,n) or integration (d,l) bins. All model results and related data are plotted from -50 to +150 kyr relative to the onset of the CIE, on our preferred orbital age model25.

