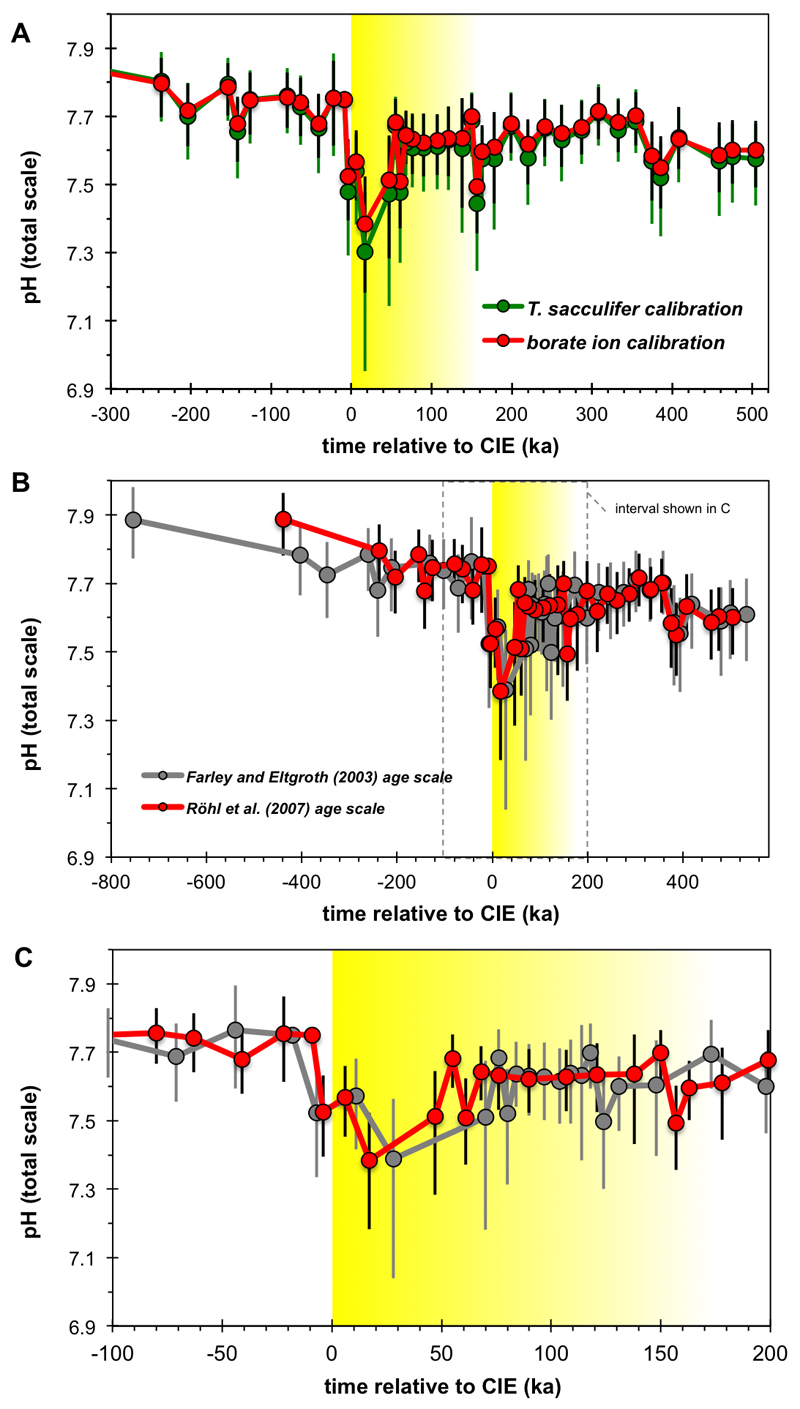
Extended Data Fig. 3. Illustration of δ11B to pH conversion as well as age model differences.
(a) Comparison of pH evolution at Site 401 over the PETM CIE using either the borate ion47 (red) or alternatively the T. sacculifer43 (green) calibration. Age scale used is following Röhl et al.25. (b) Direct comparison of our two age models, showing the reconstructed pH evolution of Site 401 plotted using either the age model of Farley and Eltgroth57 or our preferred age model of Röhl et al.25. (c) Expanded view of (b).

