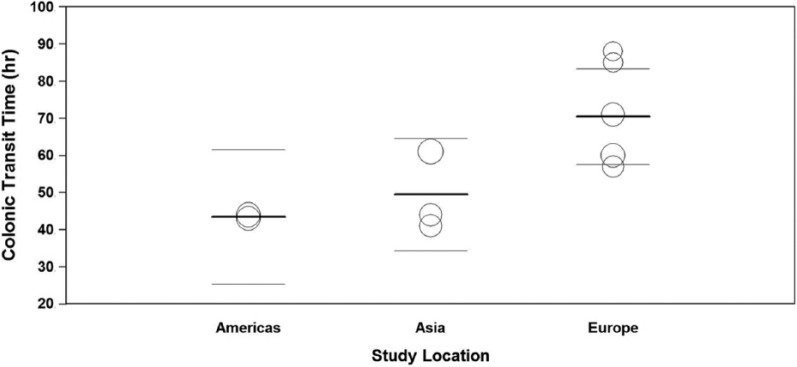
Figure 3.
Meta-regression of relationship between geographic location and colonic transit time in adults with functional constipation. Percentage of variance in transit time explained by geography = 57%, P = .04. Pairwise comparisons: Europe vs Asia, P = .04; Europe vs Americas, P = .02. Open circles represent values of individual studies where circle size is proportional to the study weight in the random-effects model. Thick lines represent the pooled mean in each group. Thin lines represent the 95% confidence interval of the pooled mean in each group.

