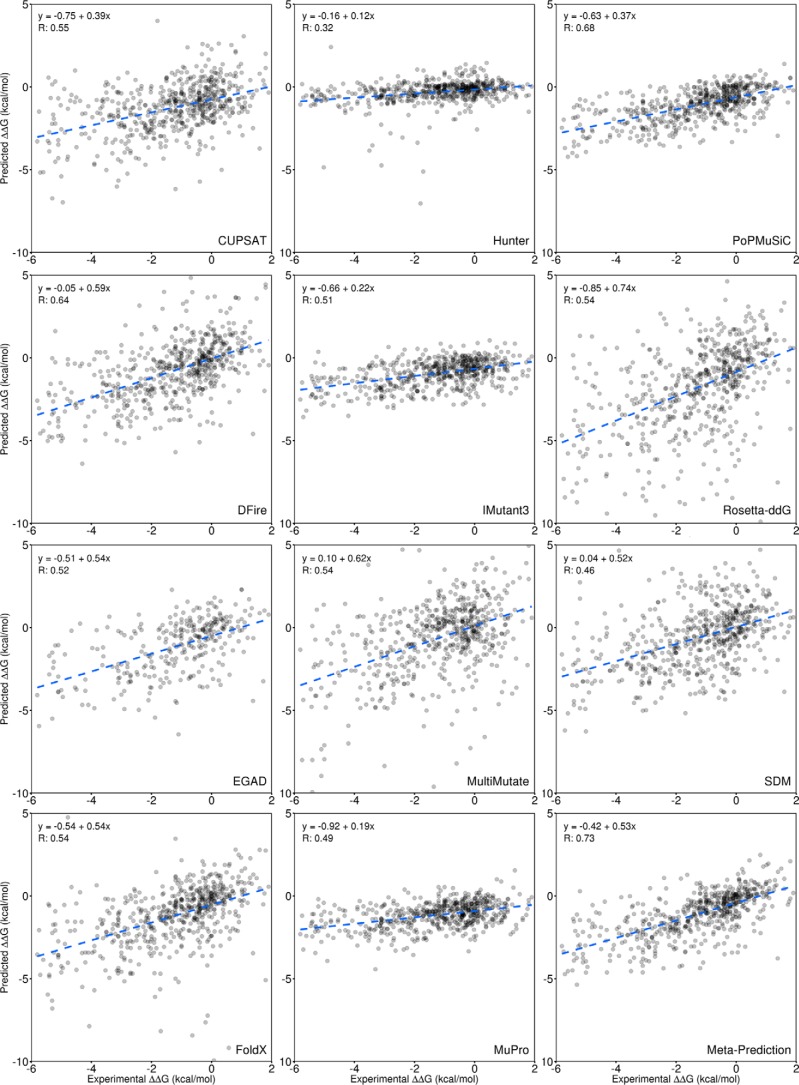
Figure 2.
Comparison of individual tools with the meta-predictor. The predicted ΔΔG for a point mutation is compared with the experimentally determined value for 605 mutations from the Protherm database (42). This comparison is performed for each of the individual prediction tools and the meta-predictor (bottom right). The equations for the linear fit are given as well as the Pearson (R) correlation coefficient based on the mean of 1000 samples of 50% of the data, as shown in Table 1.

