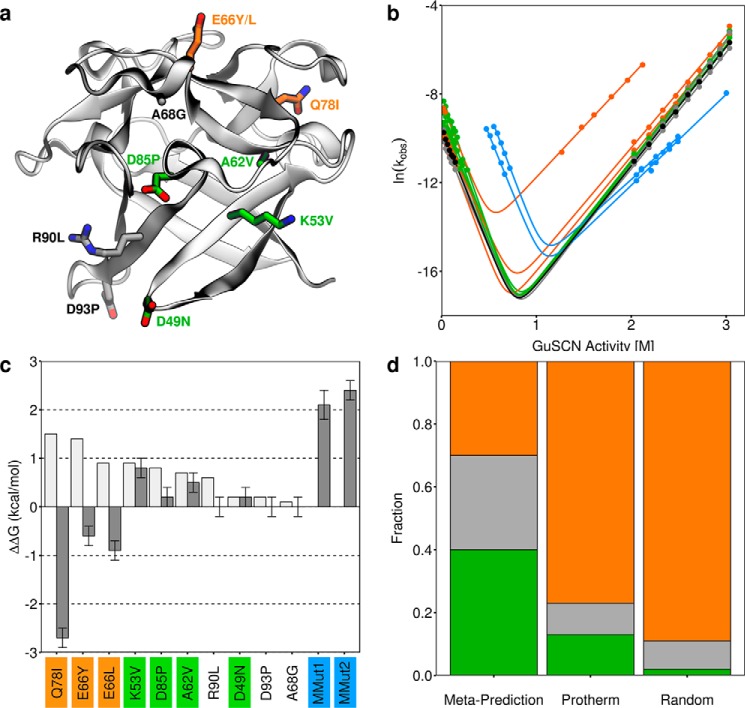
Figure 3.
Experimental characterization of mutations to ThreeFoil. a, ThreeFoil's structure with sites of mutation shown as sticks. Stabilizing mutations are shown in green, destabilizing mutations in orange, and neutral in gray. b, folding and unfolding kinetics of ThreeFoil and mutants. The same colors are used as in a, with wild type shown in black and the highly stabilized multiple mutants in blue. Solid lines, fits of the data to a two-state unfolding model using Equation 3. c, predicted (light gray) and experimentally determined (dark gray) change in thermodynamic stability for ThreeFoil mutants, ΔΔGU − F. Positive values indicate increased stability, calculated using folding and unfolding rate constants in the absence of denaturant (see “Experimental procedures” and Table 2). d, fractions of mutations that are stabilizing (green, ΔΔGU − F ≥ 0.2 kcal/mol), neutral (gray, 0.2 kcal/mol > ΔΔGU − F > −0.2 kcal/mol), or destabilizing (orange, ΔΔGU − F ≤ −0.2 kcal/mol) determined for ThreeFoil mutants designed using the meta-predictor, the Protherm database, and random mutagenesis (from deep sequencing studies (12, 57–59); see supplemental Table S2). Error bars, uncertainty from linear fit using Origin 5 software.

