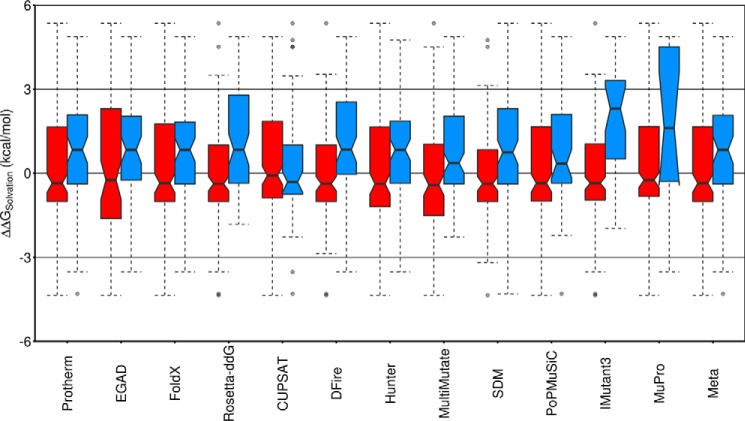
Figure 5.
Stabilizing mutations on the protein surface favor increasing hydrophobicity. The changes in side chain solvation free energy, ΔΔGsolvation (kcal/mol) (65) for all 229 solvent-exposed mutations in the Protherm-derived data set (positive ΔΔGsolvation indicates a mutation to a more hydrophobic residue with reduced solubility in water (65)) are shown as box plots. Red boxes, mutations predicted to destabilize (ΔΔGU − F ≤ −0.2 kcal/mol); blue boxes, mutations predicted to stabilize (ΔΔGU − F ≥ 0.2 kcal/mol). For the Protherm-derived data set (far left), red indicates mutations experimentally determined to destabilize, and blue indicates mutations experimentally determined to stabilize relative to the wild-type protein. The notched region around the median (horizontal line) of each box represents the 95% confidence interval for the median, indicating that for Protherm and the majority of the predictors, mutations on the protein surface that increase stability tend to be to more hydrophobic amino acids, whereas mutations that decrease stability tend to be to more hydrophilic amino acids (CUPSAT is the singular exception). The colored region of each box includes the middle 50% of the data, with dashed whiskers showing 1.5 times the interquartile range above and below the middle 50% (the interquartile range is the difference between the top and bottom of the colored region, or the difference between the 25th and 75th percentiles). Outliers (mutations outside the whiskers) are shown as semitransparent single points.

