
Figure 10.
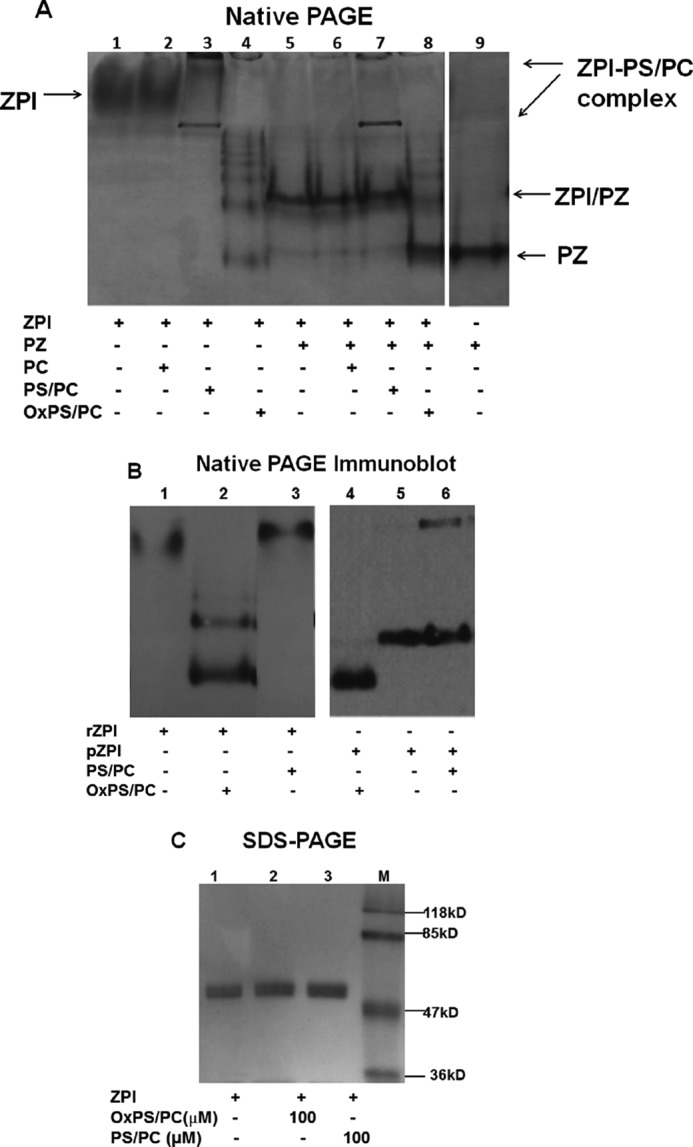
PAGE analysis of the products of OxPS/PC inactivation of ZPI. A, 5.5% native PAGE analysis of 2 μm ZPI (4 μg) alone (lanes 1–4) or with added PZ (1.7 μm, 4.3 μg) (lanes 5–8) after incubation without lipid or with 200 μm PC, PS/PC, or OxPS/PC vesicles in buffer without calcium when PZ was absent and with 5 mm Ca2+ when PZ was present for 25 min. Lane 9, PZ alone. Protein bands were detected by Coomassie Blue staining. B, 5.5% native PAGE analysis of 60 nm rZPI (lanes 1–3) or pZPI (lanes 4–6) after incubation in the absence or presence of 50 μm 18:3 OxPS/PC or PS/PC in calcium-free buffer at 25 °C for 25 min. ZPI bands were detected by immunoblotting with an anti-ZPI antibody as described under “Experimental procedures.” C, SDS-PAGE of 1.5 μm ZPI (3 μg) after incubation without lipid or with 100 μm OxPS/PC or PS/PC vesicles for 25 min in calcium-free buffer. Protein bands were stained with Coomassie Blue. Molecular weight markers are in lane M.