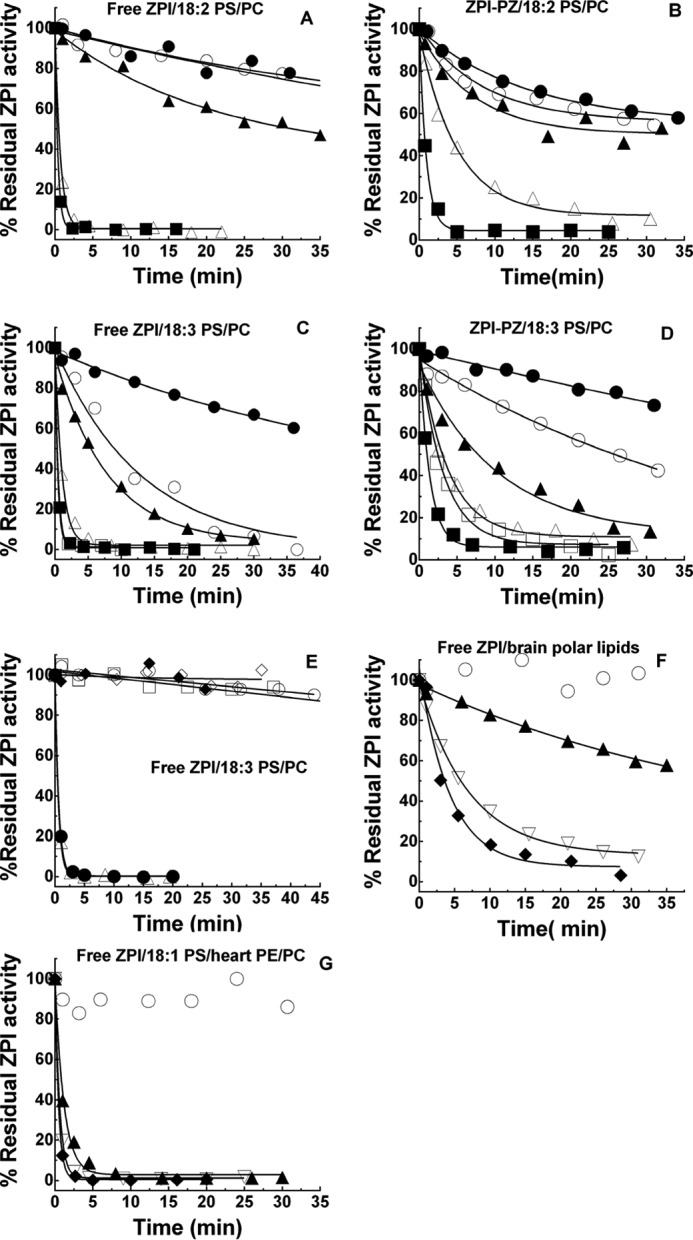
Figure 4.

Correlation of PS/PC oxidation with potency in ZPI inactivation. Progress curves of the inactivation of 150 nm free ZPI in calcium-free buffer or 150 nm ZPI-PZ complex in buffer plus 5 mm Ca2+ by 50 μm lipid vesicles after varying times of oxidation are shown. Vesicles (500 μm) were oxidized with 200 μm CuSO4, 2 mm H2O2 for 45 min at 37 °C and then at 4 °C (panels A–D, F, and G) or with 10 μm CuSO4 at 37 °C (panel E) for the times indicated before diluting 10-fold into ZPI or ZPI-PZ complex. A, free ZPI reactions with 18:2 PS/PC oxidized for 0.5 (●), 3.7 (○), 6.1 (▴), 24 (▵), and 49 h (■); B, ZPI-PZ complex reactions with 18:2 PS/PC oxidized for 0.14 (●), 1.8 (○), 5.4 (▴), 24 (▵), and 51 h (■); C, free ZPI reactions with 18:3 PS/PC oxidized for 0.6 (●), 2.9 (○), 5.7 (▴), 24 (▵), 30 (□), and 48 h (■); D, ZPI-PZ complex reactions with 18:3 PS/PC oxidized for 0.2 (●), 1.8 (○), 4.5 (▴), 23 (▵), 28 (□), and 48 h (■); E, free ZPI reactions with 18:3 PS/PC vesicles oxidized for 2.7 (○), 5.2 (□), 18 (▵), and 26 h (●) or incubated without oxidant for 3 (♦) or 23 h (♢); F, free ZPI reactions with natural porcine brain polar lipid vesicles oxidized for 2 (○), 22 (▴), 45 (▿), and 70 h (♦); G, free ZPI reactions with vesicles comprised of synthetic 18:1 PS and natural bovine heart PE and PC after oxidation for 3 (○), 28 (▴), 51 (▿), and 74 h (♦). Residual ZPI activity was measured as described under “Experimental procedures.” Lines are empirically drawn through the data points.
