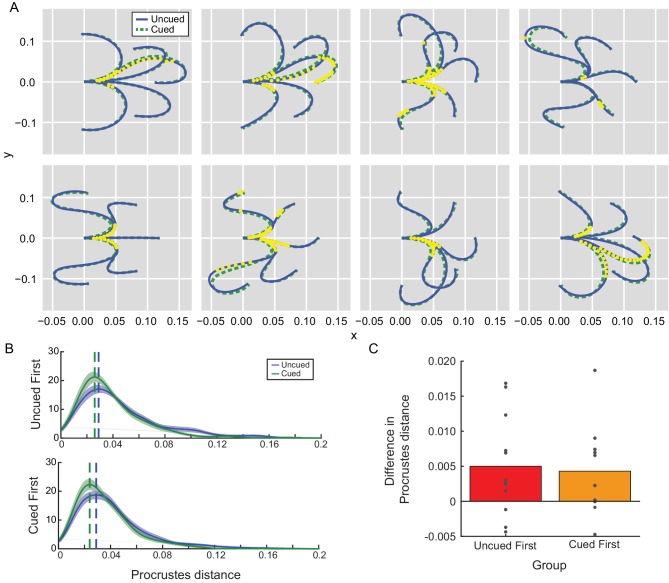
Figure 4. Movement kinematics in Experiment 2A depended on the presence of the path cue.
(A) Average reach trajectories across participants for each barrier configuration for uncued (blue) and cued (green) conditions. Each yellow dot represents a time at which the mean trajectories were found to be consistently different between conditions. Since no significant effect of order was observed, data were collapsed across groups. (B) Trajectory shapes for cued and uncued reaches were examined for their similarity to the path cue according to a Procrustes distance analysis. A Procrustes distance of zero means the trajectory is identical in shape to the path cue. Distributions of estimated Procrustes distances pooled across all trajectory shapes were averaged across all participants in each group (uncued-first or cued-first) and are shown for comparison; the mode of each distribution is indicated by the vertical dashed line for visualization purposes. No significant effect of order (group) was observed. (C) Average difference in Procrustes difference between uncued and cued reaches for each individual participant is shown; positive differences indicate that cued reaches are more similar in shape to the path cue compared to uncued reaches.

