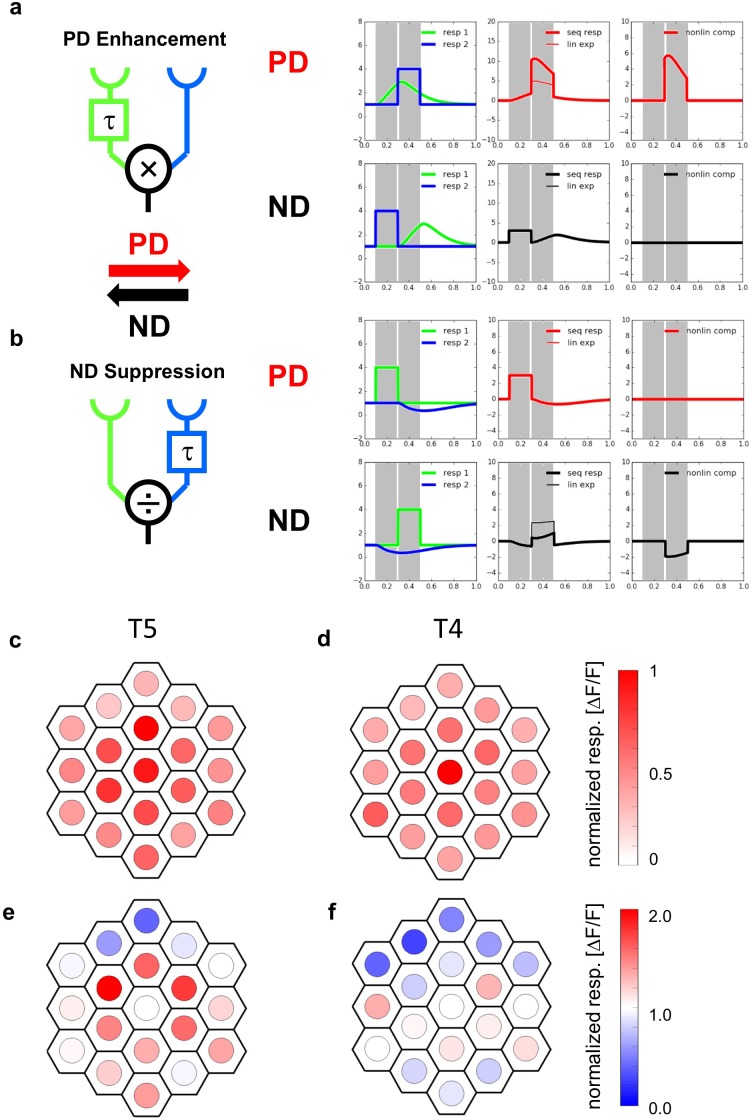
Figure 1. Receptive fields and responses to apparent motion stimuli of T5-cells.
(a) The Hassenstein-Reichardt model incorporates PD enhancement only, realized by a multiplication. Left: Responses to individual light pulses (‘Flicker’) delivered at the two different positions. The responses are shifted according to the stimulus sequence used for the subsequent apparent motion stimuli. Middle: Responses of the model to apparent motion stimuli in preferred (upper row) and null direction (lower row, thick line = measured response, thin line = linear expectation, that is sum of responses to the single light pulses). Right: Nonlinear response component defined as the difference between measured response and linear expectation. (b) same as (a) but for a Barlow-Levick model. This model incorporates ND-suppression only, realized by a division. (c) Average responses of five T5 cells to flicker stimuli (stimulus size: 5 degree) delivered to different optical columns. In order to average the responses of different flies, the response patterns were aligned and normalized with respect to the maximum response (central column) and shown in a false color code. (d) Same as (c) but for T4-cells. Data represent the mean of 10 T4-cells from 10 flies (from Haag et al., 2016). (e) Responses of T5 cells to stimuli presented to the central column and simultaneously to one of the columns of the two surrounding rings. As in c, the responses of different flies were aligned with respect to the column eliciting the maximum response when stimulated individually and normalized to it. Depending on the location, simultaneous stimulation of a second column led to either a suppressed (blue colors) or an enhanced (red colors) response compared to the exclusive stimulation of the central column. The suppression is stronger on the null side of the T5 cells. Data represent the mean of 6 T5 cells from 6 different flies. (f) Same as e) but for T4-cells. Data represent the mean of T4-cells from 8 flies (from Haag et al., 2016).


