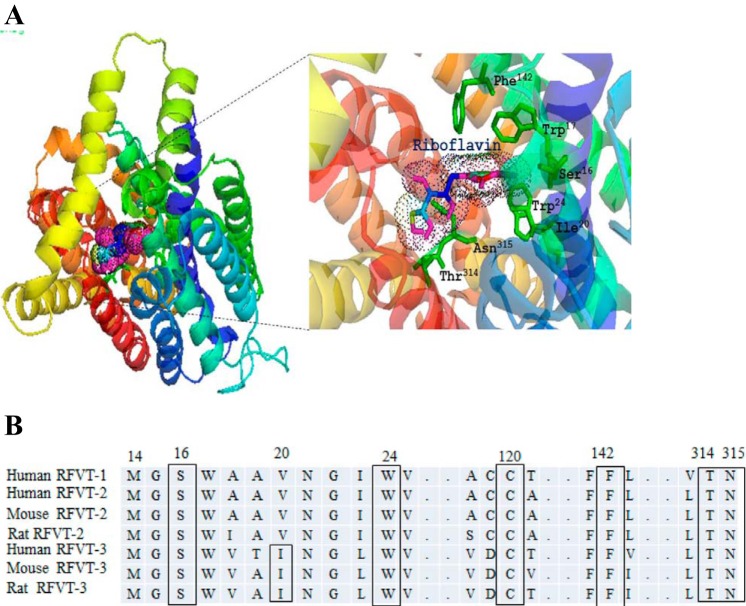
Fig. 6.
Homology modeling of the hRFVT-3 protein showing location of the putative substrate interaction residues. A: the docking model of hRFVT-3 with RF was generated using the docking server. The protein (hRFVT-3) is shown as a multicolor ribbon representation and RF as wire mesh pattern. The homology modeling of hRFVT-3 was generated based on the crystal structure of the glucose transporter (PDB ID:c4LDSB) (5). B: RFVT amino acid sequences in humans, mouse, and rat. The locations of the predicted substrate interaction residues are shown in box.

