Fig. 1.
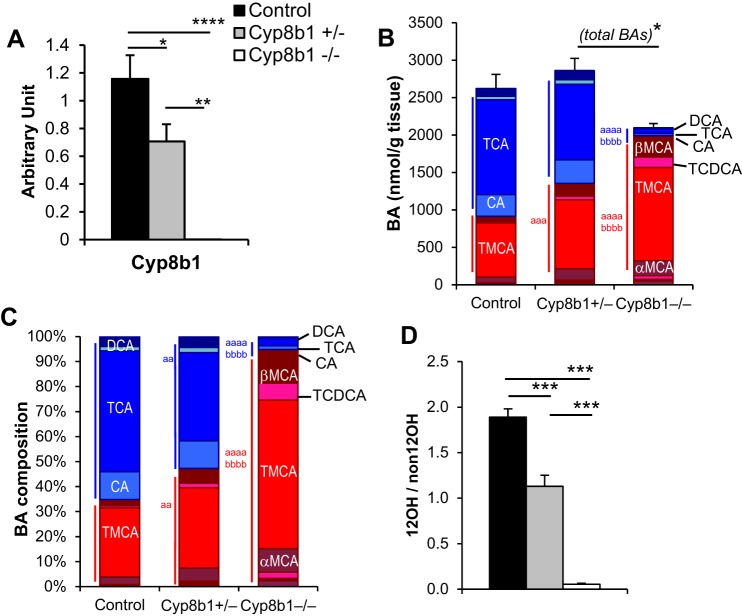
Cyp8b1 expression and bile acid quantitation. A: liver gene expression of Cyp8b1. B: absolute quantitation of the total bile acid pool. 12-Hydroxylated bile acids are colored in shades of blue. Non-12-hydroxylated bile acids are colored in shades of red. C: relative bile acid pool composition. D: ratio of 12-hydroxylated to non-12-hydroxylated bile acids. *P < 0.05, **P < 0.01, ***P < 0.001, ****P < 0.0001 between indicated groups. aaP < 0.01, aaaP < 0.001, aaaaP < 0.0001 compared with control; bbbbP < 0.0001 compared with heterozygous. Symbols in blue show statistics for comparisons of 12-hydroxylated bile acids. Symbols in red show statistics for comparisons of non-12-hydroxylated bile acids. DCA, deoxycholic acid; TCDCA, taurochenodeoxycholic acid; TMCA, tauro-α- and tauro-β-muricholic acid.

