Fig. 3.
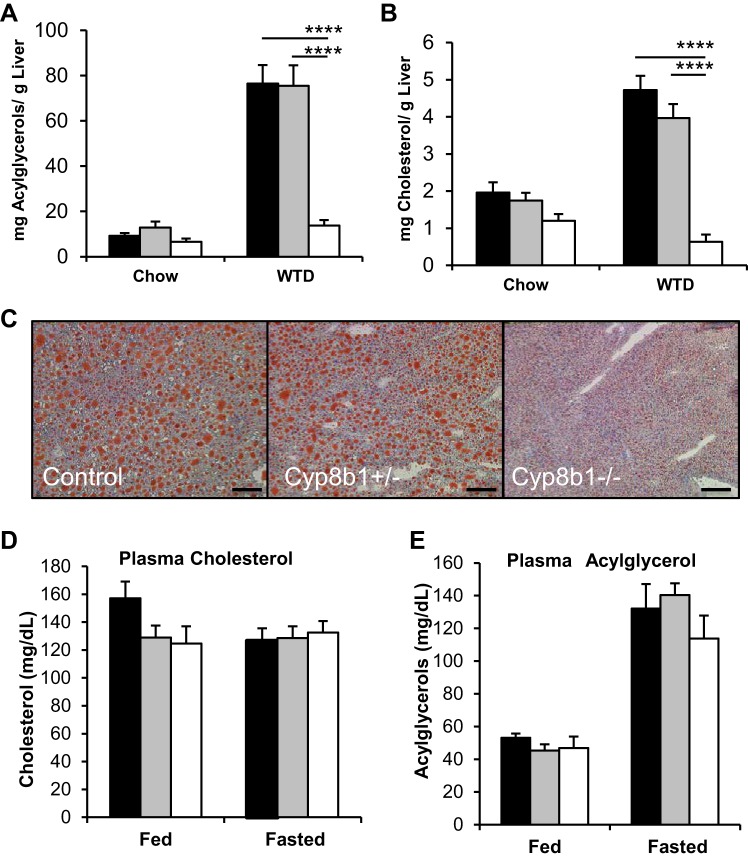
Hepatic and circulating lipids. A–C: hepatic acylglycerols and cholesterol during chow and WTD feeding and Oil Red O staining of frozen livers. Scale bar is 200 μm. D and E: plasma levels of cholesterol and acylglycerols in the ad libitum fed and overnight fasted state. Values are displayed as means ± SE; n = 7. For cholesterol and acylglycerols, results are averaged from two technical replicates. Statistical significance is represented as ****P < 0.0001 Cyp8b1+/− vs. control, measured by one-way ANOVA.

