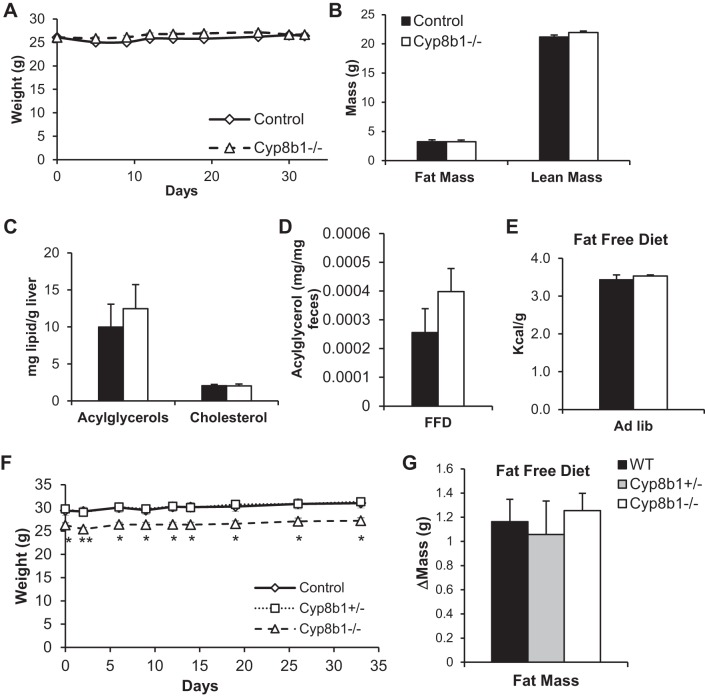
Fig. 9.
Fat-free diet feeding. A: body weight curves of mice on fat-free diet, for mice starting at the same body weight. B–E show measurements from these mice. B: body mass composition after 3-wk FFD feeding. C: hepatic levels of acylglycerols and cholesterol. D: levels of fecal acylglycerols. E: fecal caloric content from mice fed FFD, ad libitum. F: body weight curve of mice on FFD. G: fat mass gain after 4 wk of FFD feeding, for same mice shown in F. Values are displayed as mean ± SE; n = 6. Statistical significance is represented as *P < 0.05, **P < 0.01, Cyp8b1−/− vs. control, measured by one-way ANOVA. WT, wild type.

